Signs of Turning Around
Author: Icon8888 | Publish date: Mon, 22 Jun 2015, 03:54 PM
1. Introduction
I first wrote about Thong Guan in July 2014.
http://klse.i3investor.com/blogs/icon8888/53185.jsp
http://klse.i3investor.com/blogs/icon8888/55804.jsp
On 27 February 2015, Thong Guan reported a loss for Q4 of FY2014. Share price nose dived. On 5 March 2015, I took the opportunity to buy some.
http://klse.i3investor.com/blogs/icon8888/72307.jsp
Share price has not done well after I bought it. An insider has been persistently selling.
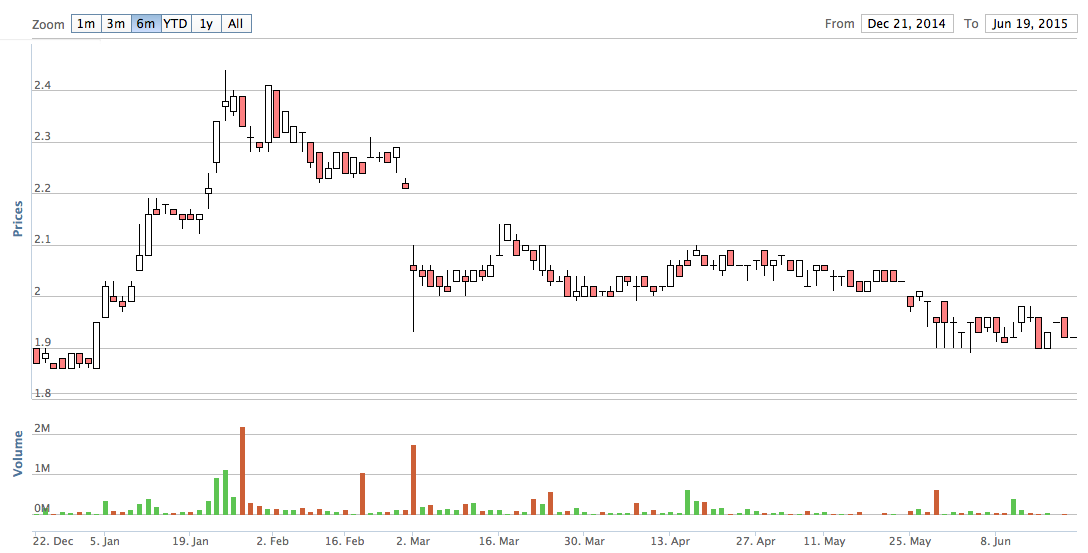
(Thong Guan Share price over past six months - a sea of red)
Between 5 March 2015 (being the date of my previous article) and 27 May 2015 (announcement of Q1 FY205 results), a total of 7 mil shares had changed hand. That is approximately 7% of the ordinary shares outstanding.
Of course, not the entire amount could be attributed to that seller. But my guess is that he is reposnsible for the bulk of it. Whoever he is, he must be somebody with intimate knowledge of whatever is happening in the company. Otherwise, how could he be selling full three months ahead of everybody else ?
I soon found out the reason why he has been busy selling.
On 27 May 2015, Thong Guan released its first quarter results for FY2015. It reported net profit of RM4.6 mil only.
Accustomed to average net profit of approximately RM7 mil per quarter over past three years, RM4.6 mil is apparently not a pleasing figure. Market took it badly and share price took another round of beating, declining from RM2.00 to RM1.90.
How actually has the company been performing lately ? Is the worst over ? When can we expect it to turnaround ? Does it have the necessary platform and resources to turn around ?
It is with all these questions in mind that I undertook a detailed study of the group.
2. Historical Performance
Usually, I don't go back too many years to study a company. Too many things would have changed if the timeframe strecthes beyond three to four years.
But for this particular company, I went back all the way to 2005 to study its financials. I am curious how they fared in the past ten years with the bulk of their operation in Malaysia while most other companies had moved to lower wage countries.
The following are the historical P&L of the group from FY2005 until FY2014 :-
| (RM mil) | FY2005 | FY2006 | FY2007 | FY2008 | FY2009 | FY2010 | FY2011 | FY2012 | FY2013 | FY2014 |
| Oil price ($ per brl) (a) | 54.4 | 65.4 | 72.7 | 97.7 | 61.9 | 79.6 | 111.0 | 112.0 | 108.8 | 98.9 |
| USD : RM (b) | 3.79 | 3.67 | 3.44 | 3.32 | 3.53 | 3.23 | 3.05 (d) | 3.08 (d) | 3.13 (d) | 3.27 |
| Revenue (a) | 380.4 | 469.3 | 518.2 | 564.6 | 408.8 | 488.6 | 540.0 | 631.2 | 720.3 | 740.2 |
| Operating profit | 64.0 | 70.3 | 63.0 | 67.1 | 67.3 | 75.6 | 82.9 | 87.1 | 93.9 | 95.4 |
| optng margin (%) | 16.8 (b) | 15.0 (b) | 12.2 (b) (c) | 11.9 (b) | 16.5 | 15.5 (c) | 15.4 | 13.8 | 13.0 | 12.9 |
| Distribution + Admin exp / revenue (%) | 6.8 | 6.5 | 6.3 (c) | 6.2 | 8.4 (c) | 7.2 (c) | 7.3 (d) | 6.7 | 6.1 (d) | 6.5 |
| distbn + admin exp | (26.0) | (30.4) | (32.7) | (35.1) | (34.2) | (35.3) | (39.2) | (42.6) | (44.3) | (47.9) |
| Depreciation | (10.7) | (12.8) | (14.4) | (14.6) | (14.6) | (14.5) | (16.3) | (16.7) | (17.1) | (18.1) |
| Int expenses | (1.6) | (3.1) | (3.0) (c) | (2.3) | (0.8) | (0.6) (c) | (0.7) | (0.8) | (0.9) | (1.2) |
| Forex | 0.3 | 2.6 | 2.1 | 1.6 | 0.8 | (2.5) | 1.3 | 2.3 | 0.2 | (4.0) |
| Other EIs | 0.0 | 0.0 | 1.0 | (13.0) ^ | 0.0 | 0.0 | 0.0 | 0.0 | 0.0 | (5.5) |
| PBT | 26.1 | 26.7 | 16.0 | 3.8 | 18.5 | 22.7 | 28.1 | 29.3 | 31.8 | 18.8 |
| Tax | (3.6) | (5.6) | (4.0) | 0.8 | (3.4) | (2.9) | (0.9) | (1.3) | (3.0) | (0.4) |
| Net profit (b) | 22.5 | 21.1 | 12.0 | 4.6 | 15.2 | 19.8 | 27.1 (d) | 28.0 (d) | 28.8 (d) | 18.4 |
| Tax rate (%) | 13.7 | 21.1 | 25.0 (c) | n/a | 18.2 | 12.6 (c) | 3.3 | 4.4 | 9.4 | 2.2 |
^ due to write down of inventories
Key observations :-
(a) Oil Price Does Not Affect Profitability
Revenue tracked brent crude oil price closely. However, oil price has no bearing on profitability as cost / saving will be passed through to end buyers.
(b) 2005 to 2008 - Overwhelmed by Strong Ringgit
In 1998, the Ringgit was pegged at 3.80 per USD. However, in 2005, the peg was removed. Over the subequent few years, Ringgit gradually strengthened from RM3.80 in 2005 to RM3.32 in 2008.
As the group exports most of its products, it suffered erosion of profit margin. The trend was very clear - operating margin dropped from 16.8% in FY2005 all the way to 11.9% in FY2008 on almost straight line basis.
As a result, net profit declined consistently from RM22.5 mil in FY2005 to RM12.0 mil in FY2007.
(Note : FY2008 was affected by sub prime crisis so it is difficult to tell exactly how much impact the exchange rate has on the group)
(c) 2009 to 2010 - The Recovery Years
As the subprime crisis subsided in 2009, the group's profitability gradually recovered.
In FY2010, with the Ringgit exchange rate at 3.23, the Group managed to report net profit of RM19.8 mil.
That was actually a marked improvement. Why ? Because in FY2007, with Ringgit at 3.44 (weaker than FY2010's 3.23), the group was only able to report net profit of RM12 mil.
The following items contributed to earnings improvement :-
(i) Lower tax rate
FY2010's tax rate of 12.6% was almost 50% lower than FY2007's 25%. With this lower tax rate, the group managed to save RM2.8 mil.
How should we treat the tax advantage ? Is it something to be sneezed at ? Something similar to property revaluation surplus - nice to look at but dismissed by investors as superficial gain ?
Not exactly. I would argue that low tax rate is a result of careful corporate planning. It is not a one off item. Instead, once kicked in, it usually last for a long period of time. As such, it should be treated as part of operation.
According to Thong Guan's FY2010 annual report, it was supposed to pay tax of RM5.66 mil. However, there was a tax incentive of RM2.62 mil, which helped to bring down the effective tax rate.
The low tax rate continued throughout the subsequent years.
(ii) Lower Interest Expenses
FY2010's interest expenses of RM0.6 mil was RM2.4 mil lower than FY2007's RM3 mil.
In FY2007, the group has RM59 mil loans. In FY2010, the amount has been reduced to RM22 mil.
(iii) Anti Dumping Duties Help To Improve Operating Margin
In 2010, EU imposed anti dumping duties on plastic bags producers based in China and Thailand. The duties benefit companies like Thong Guan as it reduced competitive pressure.
I believe that was one of the reasons why operating margin improved from 12.2% in FY2007 to 15.5% in FY2010 **.
** the anti dumping duties was removed in July 2012 and Thong Guan continued to report healthy profit thereafter
(d) 2011 to 2013 - Healthy Profit Despite Strong Ringgit
Perhaps the most striking findings from studying Thong Guan's past performance was how well it has performed during 2011 to 2013 despite strong Ringgit.
During the period from FY2011 to FY2013, average Ringgit exchange rate was 3.09 per USD. This was all time high since 1998. With Ringgit at this level, many other Malaysia based manufacturing companies had lost their vitality. But Thong Guan was thriving during those years. On average, it reported net profit of RM28 mil per annum (consistently).
(Thong Guan did have operation in China, but that only accounted for 25% of its asset base. The majority was still in Malaysia)
The 2010 anti dumping duties imposed by EU on China and Thailand based plastic bags producers was uplifted in July 2012 and yet Thong Guan was able to maintain its profitability. What were the contributing factors ?
The following are some of the possible reasons :-
(i) Cost Rationalisation
In annual reports, the company mentioned that healthy profitability was partly due to cost rationalisation exercise.
This was consistent with the financials. As a percentage of revenue, distribution and administration expenses declined from 7.2% in FY2011 to 6.1% in FY2013.
Bearing in mind the huge turnover, small decline in percentage term will translate into huge numbers. Based on the group's revenue of RM720 mil in FY2013, 1.1% translates into savings of RM7.9 mil. In view of low tax rate, almost the entire amount will flow directly down to bottomline.
(ii) PVC Food Wrap Started Contributing
In December 2011, Thong Guan announced that it has entered into a joint venture with Kim Young Tae (a South Korean national) to set up a PVC cling films (food wrap) manufacturing operation. The joint venture entity is called Power Wrap Sdn Bhd. Thong Guan and Kim will hold 85% and 15% euity interest in Power Wrap respectively.
Kim has more than 20 years experience in PVC cling films manufacturing having previously worked for a South Korean multi national corporation involving in the relevant business.
By using the cash from the equity capital injection, Power Wrap acquired two cling films production lines in 2012 for RM6 mil.
Power Wrap turned out to be a success and was one of the reasons for Thong Guan's healthy performance in recent years :-
| (RM mil) | FY2013 | FY2014 |
| Revenue | 20.52 | 32.76 |
| PAT | 1.89 | 3.25 |
| MI | (0.28) | (0.49) |
| Net profit | 1.61 | 2.76 |
| Margin (%) | 7.84 | 8.42 |
(source : FY2014 annual report)
As can be seen from the table above, Power Wrap has lucrative net profit margin of approximately 8%. This is substantially higher than Thong Guan's average net profit margin of approximately 4.5% during the 2011 to 2013 period.
In view of its favorable economics, Power Wrap has expanded its production capacity by commissioning additional two production lines in Q1 of 2014.
In Q4 of 2014, Power Wrap commissioned another 2 production lines. This bring the total number of production lines to 6.
As a result, in FY2014, the cling films division's revenue and net profit grew by an impressive 60% and 71% respectively, compared to FY2013.
It seemed that the group intends to further expand this division. According to an interview with The Star on 18 August 2014, the group will spend altogether RM25 mil capex on the cling films division and makes it the largest producer in South East Asia by 2016.
(Note : The group spent RM6 mil in 2012 to commission 2 production lines. This worked out to be RM3 mil per line. Does RM25 mil capex imply additional 8 lines ? Add it to the original 2 lines, ultimately will have 10 lines ?)
In the event that Power Wrap has 10 production lines, how much net profit will it generate ? The following table is a sensitivity analysis based on extrapolation of FY2013 performance (2 lines generated RM1.61 mil net profit) :-
| Lines | Capacity | Revenue | Net profit | Net Margin |
| (MT) | (RM mil) | (RM mil) | (%) | |
| 1 | 1,500 | 10.3 | 0.81 | 7.8 |
| 2 | 3,000 | 20.5 | 1.61 | 7.8 |
| 4 | 6,000 | 41.0 | 3.22 | 7.8 |
| 6 | 9,000 | 61.6 | 4.83 | 7.8 |
| 8 | 12,000 | 82.1 | 6.44 | 7.8 |
| 10 | 15,000 | 102.6 | 8.05 | 7.8 |
Of course, as usual, I would like to qualify that the above table is for discussion purpose only. Many things would have to fall in place between now and 2016 (including favorable market conditions) in order for Power Wrap to realise its full potential of RM8 mil net profit.
(e) 2014 - Old Ways of Doing Things Might Not Work Anymore
| (RM mil) | FY2013 | Q1 FY14 | Q2 FY14 | Q3 FY14 | Q4 FY14 | FY2014 | Q1 FY15 |
| Brent crude ($ per brl) | 108.8 | 107.9 | 109.8 | 102.1 | 76.0 | 98.9 | 54.0 |
| USD : RM | 3.13 | 3.31 | 3.24 | 3.19 | 3.33 | 3.27 | 3.58 |
| Revenue | 720.3 | 177.8 | 196.0 | 191.9 | 167.0 | 740.2 | 160.8 |
| Operating profit | 93.9 | 26.1 | 25.5 | 21.1 | 22.8 | 95.4 | 25.0 |
| operating margin (%) | 13.0 | 14.7 | 13.0 | 11.0 | 13.7 | 12.9 | 15.5 |
| distbn+admin / revenue (%) | 6.1 | 6.5 | 6.2 | 6.1 | 7.4 | 6.5 | 7.4 |
| distbn + admin exp | (44.3) | (11.6) | (12.1) | (11.8) | (12.4) | (47.9) | (11.9) |
| Depreciation | (17.1) | (4.3) | (4.5) | (4.5) | (4.8) | (18.1) | (4.8) |
| Int expenses | (0.9) | (0.2) | (0.3) | (0.3) | (0.5) | (1.2) | (0.4) |
| Forex | 0.2 | 0.0 | 0.4 | (0.1) | (4.1) | (4.0) | (4.2) |
| Other EIs | 0.0 | 0.0 | 0.0 | 0.0 | (5.5) | (5.5) | 0.0 |
| PBT | 31.8 | 9.9 | 9.0 | 4.4 | (4.5) | 18.8 | 3.8 |
| Tax | (3.0) | (0.9) | (0.6) | 0.8 | 0.3 | (0.4) | 0.6 |
| Net profit | 28.8 | 9.0 | 8.4 | 5.2 | (4.2) | 18.4 | 4.3 |
| Tax rate (%) | 9.4 | 9.5 | 6.3 | n/a | n/a | 2.2 | n/a |
Thong Guan kicked off FY2014 with a promising start. During H1, it reported net profit of RM17.4 mil. If annualised, 12 months profit would have been an all time high of RM34.8 mil (past three years was approximately RM28 mil per annum).
The company attributed that to its focus on higher margin products. In first quarter of 2014, the group commissioned additional two lines for cling films production. As mentioned above, this division has high net margin of closed to 8% compared to group net margin of approximately 4.5%.
In Q3 of FY2014, the group experienced a set back. Earnings declined by 38% to RM5.2 mil. Operating margin declined from the usual 13% to 11%. The company attributed the decline to lower profit contribution from China and Sabah.
In Q4 of FY2014, the group announced a shocking loss of RM4.2 mil :-
(i) It was motly due to exceptional items of RM9.6 mil, comprises forex loss and bad debt of RM4.1 mil and RM5.5 mil respectively.
(ii) However, after stripping away those items, the underlying figures were still very disconcerting - net profit would be RM5.4 mil only. As we all know, anything below RM7 mil per annum is not consider good.
(iii) Operating margin was healthy at 13.7%. If that is the case, the dismal performance must have been due to lackluster revenue.
Again, the company attributed the decline in profitability to lower contribution from China.
(f) 2015 - A New Beginning ?
In Q1 of FY2015, the group reported another quarter that disappointed many investors. Net profit came in at RM4.3 mil only, lower than the RM7 mil per quarter widely expected.
However, I saw signs of turning around.
There was another forex loss of RM4.2 mil. Stripping that away, net profit would be RM8.5 mil, a very commendable performance.
Operating margin has also improved, rising from 13.7% in Q4 FY2014 to 15.5% in Q1 FY2015.
The group was still having problems with its China operations. However, in my opinion, the following positive factors could have compensated for the weaknesses and contributed to its "robust" performance :-
(i) Power Wrap commissioned another 2 lines in Q4 of 2014. The additional productions, which command high profit margin, would have contributed in Q1 FY2015.
(ii) The group completed installation of machinery for prestretched films in Q4 of 2014. Same as Power Wrap's cling films, this new product also commands higher profit margin.
(iii) average Ringgit to USD exchange rate was 3.58, significantly lower than 3.33 in Q4 of FY2014.
Tax rate was low and is expected to remain so in view of the group's capex.
3. Capital Expenditure
Over the past few years, the group enjoyed healthy performance with profit at approximately RM28 mil per annum. However, in 2014, they must have seen the bad weather coming. Even though Q1 FY2014 net profit was an all time high at RM9 mil, the company announced in February 2014 that they were calling for a rights issue to raise RM52 mil to acquire new machinery (RM33 mil) as well as for working capital purpose (RM18 mil).
Indirectly, they were acknowledging that industry dynamics had changed, the old ways of doing things might no longer be able to sustain earnings (this observation later turned out to be true as profit started to deteriorate in Q3 FY2014). The group needed to revamp its operation by investing in new processes and technology. On a positive note, they must have expected the capex to bring in new opportunities and result in business expansion. Hence the need for additional working capital.
As at March 2015, the group have used RM18.8 mil of the RM33 mil primarily for the following :-
(i) additional PVC cling films production lines; and
(ii) machinery for prestretched films,
all of which were commissioned in Q4 of 2014.
RM14.2 mil will be spent in 2015 on the followings :-
(i) production line for 33-layer nano-technology strecthed films;
(ii) production line for blown films (for plastic bag manufacturing?); and
(iii) R&D centre, mostly to be used to demonstrate to potential clients on the advantage of using the new products (RM5 mil).
As mentioned above, the group might install additional production lines for PVC cling films in 2015 / 2016. Maybe some of the capex will be funded by internally generated funds / bank borrowings.
Pre Stretched Film

(Conventional stretched films require the users to stretch the film physically while wrapping the objects. Most of the time, the stretching was not done properly and there will be wastage. A pre-strecthed film is a film that had already been strecthed by the manufacturer, allowing the users to avoid wastage through incorrect stretching. It also reduces the chances of physical injury)
Nano Technology Stretch Film

(Nano technology allows the film to be manufactured thinner and yet at the same time achieve the same performance. Due to usage of less raw material, this new product will allow end users to save cost)
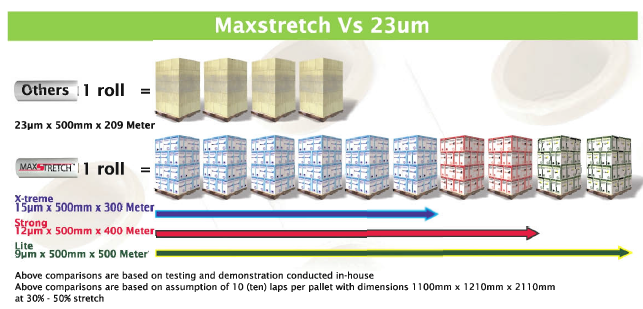
(A roll of conventional film will have thickness of 23 micro meter and length of 209 meter. The most efficient nano technology film will have thickness of 9 micro meter and length of 500 meter. Both can achieve the same performance. If you are a user, wouldn't you want to spend a little bit more to use the nano technology film ?)
4. Concluding Remarks
(a) Just like many other enterprises, for Thong Guan, change is the only constant. Throughout the years, it has proven to be able to meet the various challenges thrown at it. In my opnion, the management team is very experienced and competent. They can read the market accurately and execute well.
(b) Thong Guan's past few quarters perfomance has been affected by changes in industry landscape. However, they saw it coming at early stage and decided to meet the challenges head on by investing in new processes and technology.
(c) Will the capex programme turn out well ? I am absolutely confident that it will be successful. The management team can execute well. The new products shoudl be well received as they allow the end users to save costs.
(d) The capex programme and business expansion is timely. The weakening of Ringgit will definitely make it eaiser to market the new products.
(e) Barring unforeseen circumstances, over the next few quarters, a combination of weak Ringgit, higher capacity and better profit margin should result in robust earnings. Track this stock for opportunity.
Have a nice day.
================================
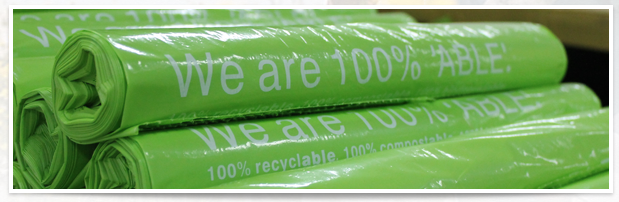
Appendix - What Does Thong Guan Do ?
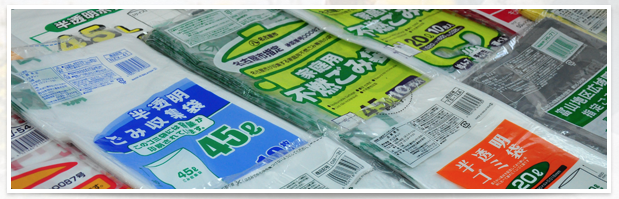
Thong Guan is principally involved in manufacturing of stretch film, garbage bags, flexible packaging and PVC food wrap.
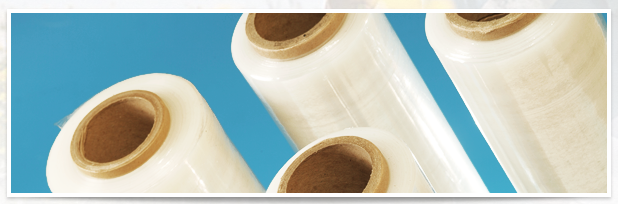
(stretch film)
(garbage bags)
(flexible packaging a.k.a. plastic bags)

(PVC food wrap)
No comments:
Post a Comment