A Simple and Easy to Understand Plastic Packaging Company
Author: Icon8888 | Publish date: Tue, 10 Mar 2015, 02:15 PM
Slp Resources Bhd (SLPR) Snapshot
Open
0.63
|
Previous Close
0.66
| |
Day High
0.66
|
Day Low
0.63
| |
52 Week High
11/7/14 - 0.76
|
52 Week Low
03/10/14 - 0.43
| |
Market Cap
163.2M
|
Average Volume 10 Days
118.6K
| |
EPS TTM
0.05
|
Shares Outstanding
247.3M
| |
EX-Date
03/16/15
|
P/E TM
13.5x
| |
Dividend
0.01
|
Dividend Yield
3.03%
|

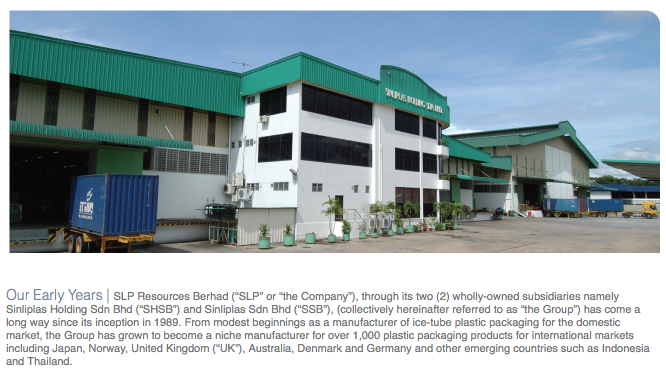
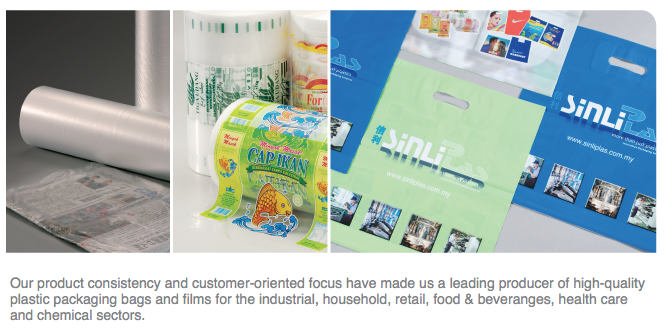
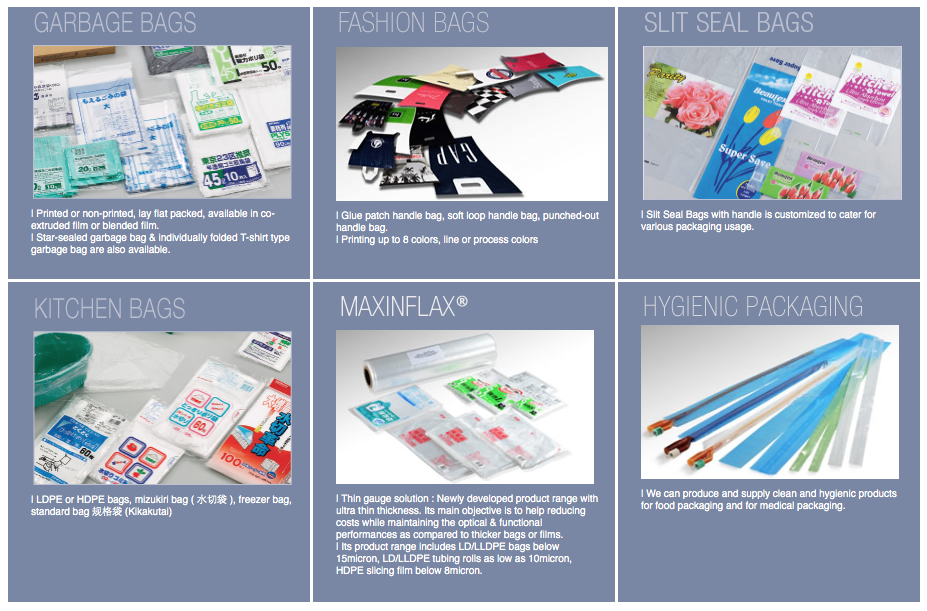
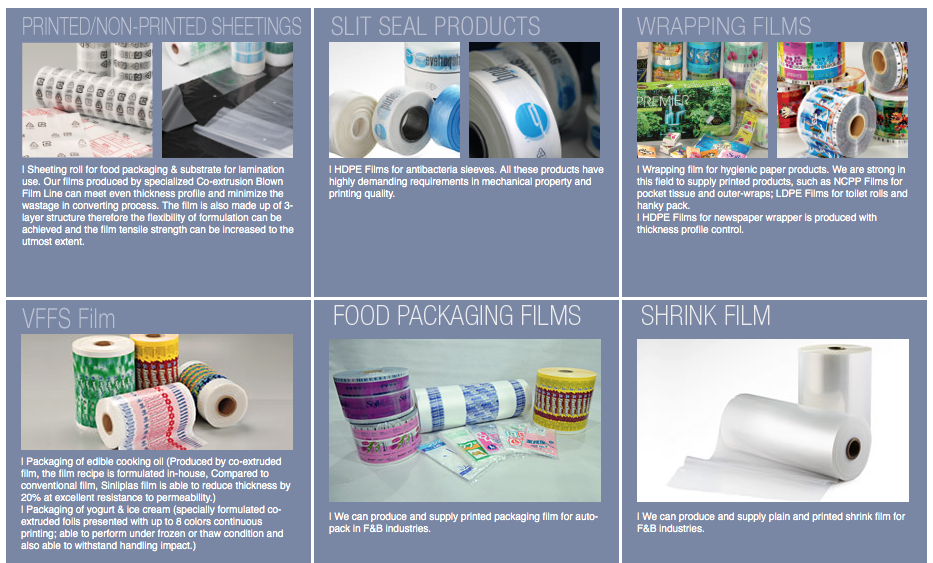
SLP Resources Berhad manufactures and sells plastic packaging and related products in Malaysia. The company offers plastic bags, including garbage, fashion, slit seal, kitchen bags, etc. It also offers polyfilms, such as printed/non-printed sheetings, wrapping films, etc.
SLP Resources Berhad also markets its products in Japan, Norway, the United Kingdom, Australia, Denmark, Germany, Indonesia, and Thailand.
The company was founded in 1989 and is headquartered in Kulim, Malaysia.
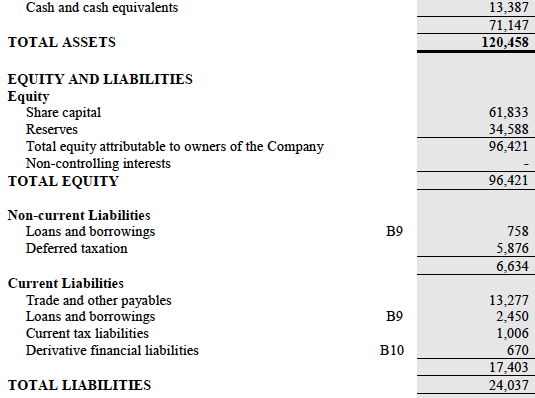
The group has strong balance sheets with net cash of approximately RM10 mil.
The group's business is quite resilient. Even during 2008 and 2009, it continues to report decent profitability.
Annual Result:
| F.Y. | Revenue ('000) | Profit Attb. to SH ('000) | EPS (Cent) | PE | DPS (Cent) | DY | NAPS | ROE (%) | |
|---|---|---|---|---|---|---|---|---|---|
| 2014-12-31 | 174,444 | 12,127 | 4.91 | 12.02 | 2.00 | 3.39 | 0.3900 | 12.59 | |
| 2013-12-31 | 161,843 | 11,240 | 4.54 | 9.48 | 2.00 | 4.65 | 0.3610 | 12.58 | |
| 2012-12-31 | 151,208 | 9,444 | 3.82 | 9.95 | 2.00 | 5.26 | 0.3350 | 11.40 | |
| 2011-12-31 | 148,961 | 6,103 | 2.46 | 15.45 | 2.00 | 5.26 | 0.3170 | 7.76 | |
| 2010-12-31 | 156,092 | 9,320 | 3.77 | 13.27 | 2.00 | 4.00 | 0.3060 | 12.32 | |
| 2009-12-31 | 130,446 | 6,605 | 2.67 | 21.35 | 2.00 | 3.51 | 0.2930 | 9.11 | |
| 2008-12-31 | 183,915 | 5,240 | 5.19 | 8.87 | 4.00 | 8.70 | 0.6600 | 7.86 | |
| 2007-12-31 | 95,615 | 10,618 | 16.00 | - | - | - | 0.5800 | 27.59 |
Net profit experienced substantial growth in 2012. As a result, share price broke out of 40 sen range and touched > 70 sen in October 2014.
Quarter Result:
| F.Y. | Quarter | Revenue ('000) | Profit before Tax ('000) | Profit Attb. to SH ('000) | EPS (Cent) | DPS (Cent) | NAPS |
|---|---|---|---|---|---|---|---|
| 2014-12-31 | 2014-12-31 | 40,389 | 4,452 | 3,951 | 1.61 | 1.00 | 0.3900 |
| 2014-12-31 | 2014-09-30 | 44,160 | 4,069 | 3,134 | 1.27 | - | 0.3740 |
| 2014-12-31 | 2014-06-30 | 45,441 | 3,035 | 2,509 | 1.01 | 1.00 | 0.3710 |
| 2014-12-31 | 2014-03-31 | 44,454 | 3,417 | 2,533 | 1.02 | - | 0.3710 |
| 2013-12-31 | 2013-12-31 | 41,243 | 3,121 | 2,260 | 0.91 | 1.00 | - |
| 2013-12-31 | 2013-09-30 | 43,103 | 5,064 | 4,053 | 1.64 | - | 0.3520 |
| 2013-12-31 | 2013-06-30 | 39,409 | 2,982 | 2,329 | 0.94 | 1.00 | 0.3450 |
| 2013-12-31 | 2013-03-31 | 38,089 | 3,305 | 2,599 | 1.05 | - | 0.3460 |
| 2012-12-31 | 2012-12-31 | 36,406 | 2,589 | 1,645 | 0.66 | 1.00 | - |
| 2012-12-31 | 2012-09-30 | 37,923 | 2,970 | 2,196 | 0.89 | 1.00 | 0.3270 |
| 2012-12-31 | 2012-06-30 | 38,534 | 3,894 | 2,824 | 1.14 | - | 0.3280 |
| 2012-12-31 | 2012-03-31 | 38,344 | 3,229 | 2,779 | 1.12 | - | 0.3270 |
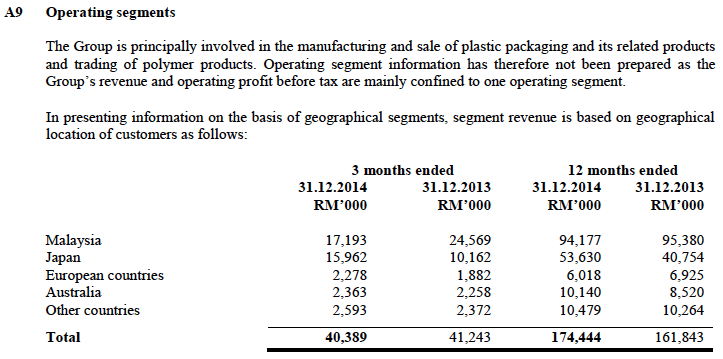
The group exports approximately 50% of its products :-
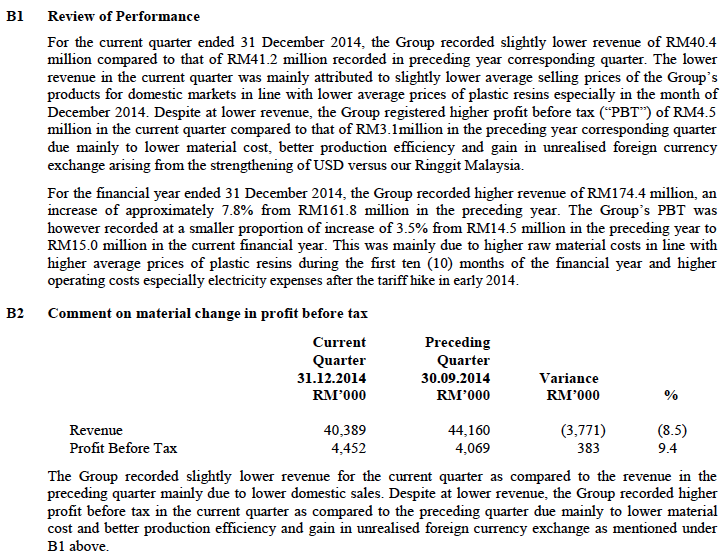
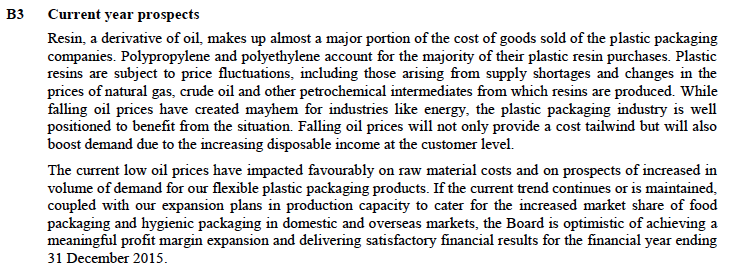
Management is quite upbeat about current year prospects :-
Please refer to Appendix 2 below for details of the group's capacity expansion.
==============================================
Appendix 1 - SLP Group


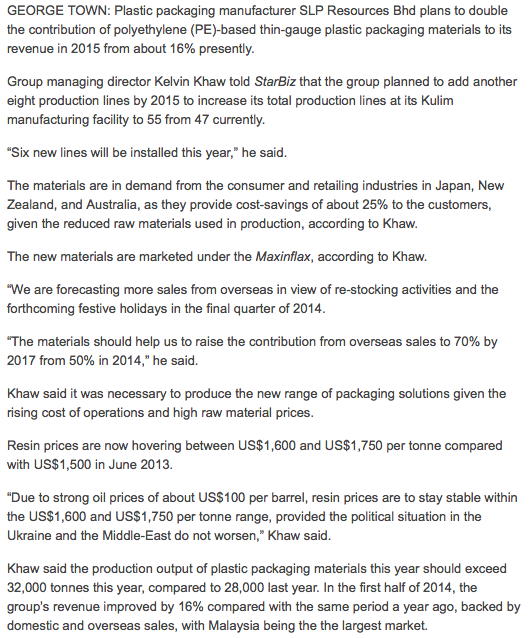
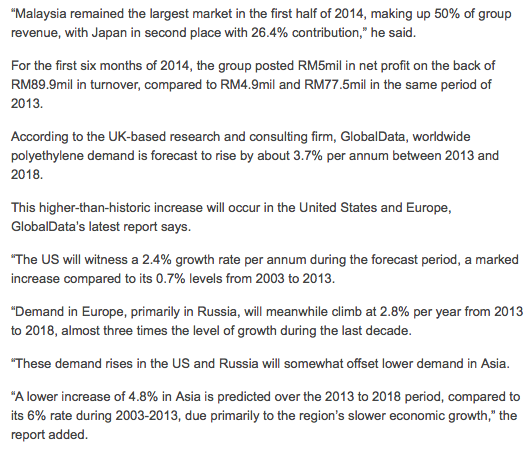
Appendix 2 - The Star Article Dated 30 September 2014
If you’re trying to compare the LDPE film price in Delhi, be sure to check out Singhal Global. They offer competitive rates without compromising on quality. Whether you need shrink wrap for packaging or protective film for transport, they have excellent options. Bulk buyers will especially appreciate their pricing transparency and customization possibilities.
ReplyDelete