All Eyes on Coming Quarter Results
Author: Icon8888 | Publish date: Thu, 5 Mar 2015, 02:18 PM

Apollo Food Holdings Bhd (APOF) Snapshot
Open
4.28
|
Previous Close
4.28
| |
Day High
4.29
|
Day Low
4.28
| |
52 Week High
08/26/14 - 5.25
|
52 Week Low
12/16/14 - 4.05
| |
Market Cap
342.4M
|
Average Volume 10 Days
17.6K
| |
EPS TTM
0.33
|
Shares Outstanding
80.0M
| |
EX-Date
12/10/14
|
P/E TM
12.8x
| |
Dividend
0.25
|
Dividend Yield
5.84%
|
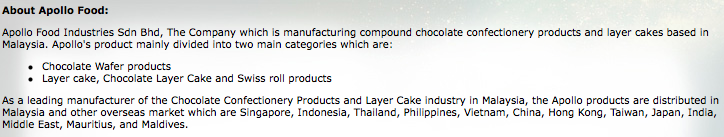
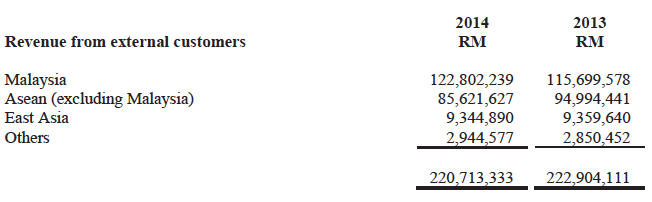
The group exports 35% of its products :-
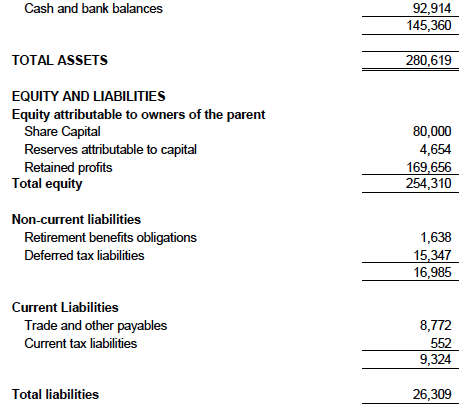
The group has strong balance sheets. With net assets of RM254 mil, zero loans and cash of RM92.9 mil, net cash is RM1.16 per share.
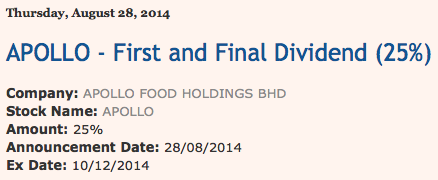
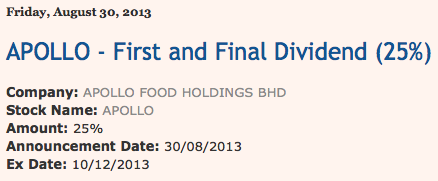
The company paid 25 sen dividend in FY2014 and FY2013. Based on RM4.30 share price, dividend yield is 5.8%.
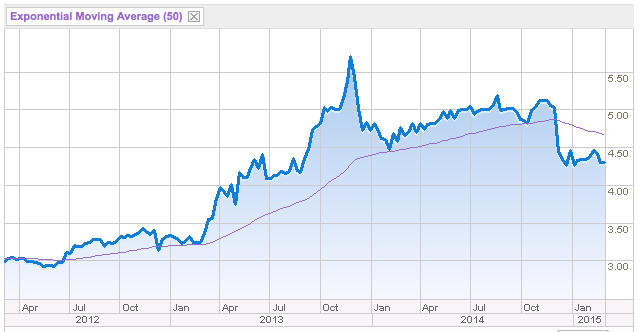
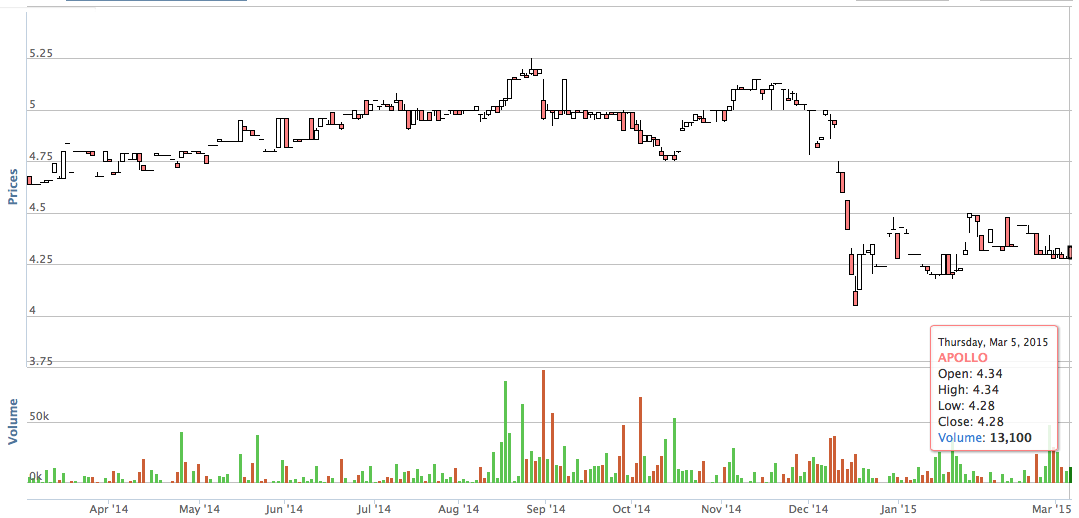
The stock has been trading at above RM5 most of last year. However, share price experienced a sharp drop after it announced its October 2014 quarterly results on 22 December 2014. Net profit came in below expecations. Company cited high raw material cost as the principal reason.
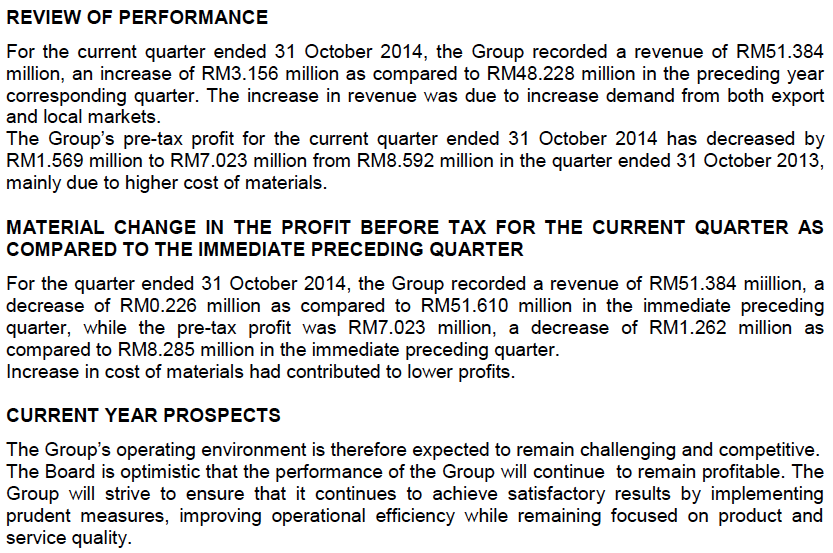
Quarter Result:
| F.Y. | Quarter | Revenue ('000) | Profit before Tax ('000) | Profit ('000) | Profit Attb. to SH ('000) | EPS (Cent) | DPS (Cent) | NAPS | |
|---|---|---|---|---|---|---|---|---|---|
| 2015-04-30 | 2014-10-31 | 51,384 | 7,023 | 4,811 | 4,811 | 6.01 | - | 3.1800 | |
| 2015-04-30 | 2014-07-31 | 51,610 | 8,285 | 5,716 | 5,716 | 7.15 | - | 3.1200 | |
| 2014-04-30 | 2014-04-30 | 59,208 | 9,270 | 7,090 | 7,090 | 8.86 | - | 3.0500 | |
| 2014-04-30 | 2014-01-31 | 55,592 | 11,823 | 9,070 | 9,070 | 11.34 | - | 2.9600 | |
| 2014-04-30 | 2013-10-31 | 48,228 | 8,592 | 6,597 | 6,597 | 8.25 | - | 3.1000 | |
| 2014-04-30 | 2013-07-31 | 57,478 | 13,920 | 10,713 | 10,713 | 13.39 | - | 3.0100 | |
| 2013-04-30 | 2013-04-30 | 54,697 | 9,574 | 7,132 | 7,132 | 8.92 | - | - | |
| 2013-04-30 | 2013-01-31 | 56,970 | 12,200 | 9,288 | 9,288 | 11.61 | - | 2.7900 | |
| 2013-04-30 | 2012-10-31 | 52,275 | 10,227 | 7,648 | 7,648 | 9.56 | - | 2.8700 | |
| 2013-04-30 | 2012-07-31 | 58,804 | 10,449 | 8,016 | 8,016 | 10.02 | 20.00 | 2.7800 | |
| 2012-04-30 | 2012-04-30 | 56,193 | 9,489 | 8,740 | 8,740 | 10.93 | - | - |
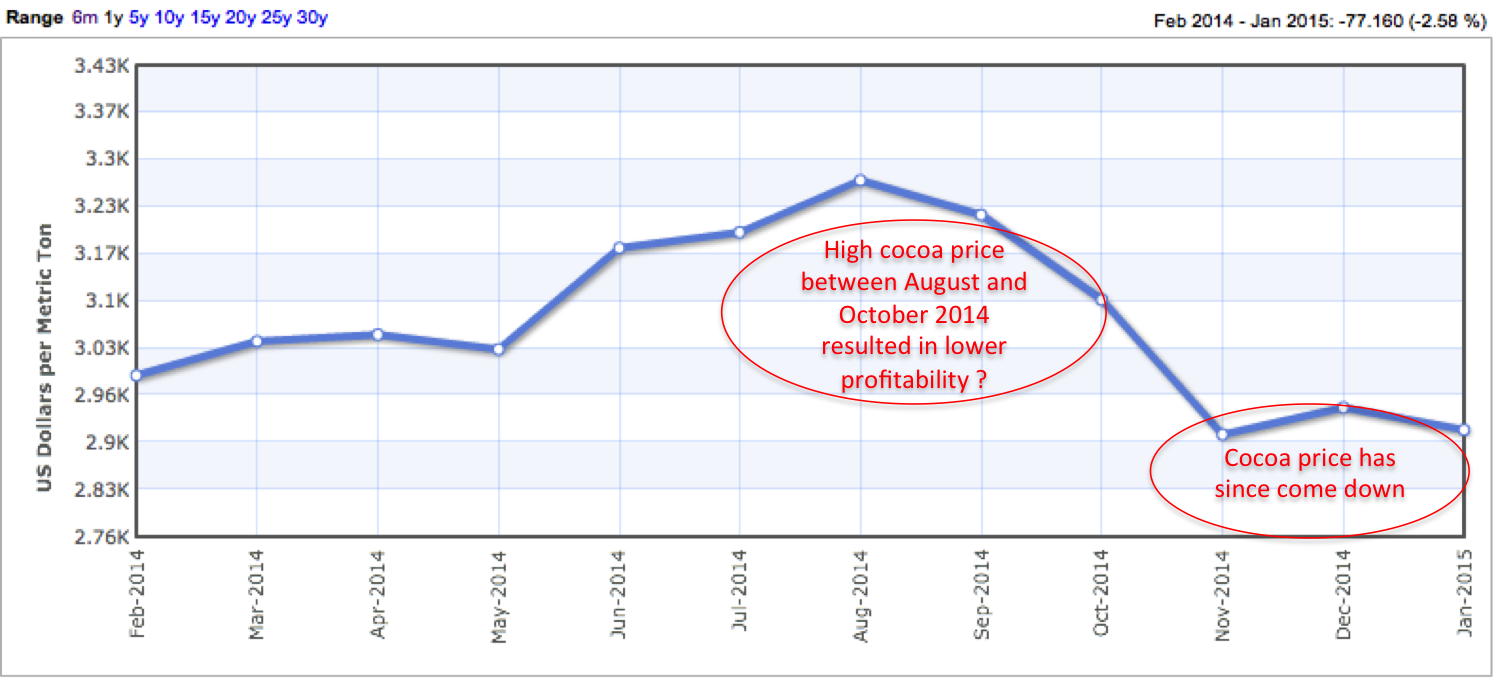
Not sure why there was a spike in raw material cost between August and October 2014. One possibility was higher cocoa price.
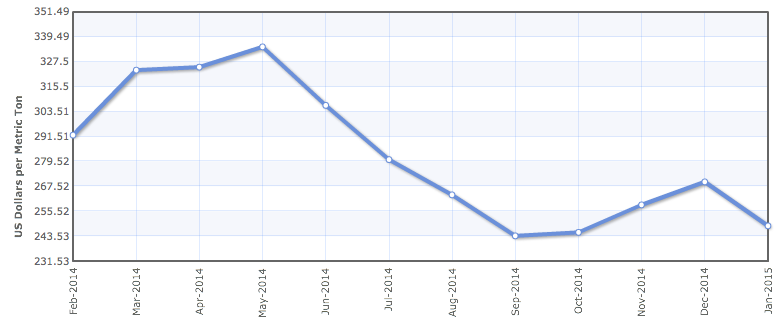
Another factor that might have impact on profitability is wheat price (flour). According to the chart below, it seemed that wheat price was more or less stable between August and December 2014. As such, it should not have much impact on the coming quarter's raw material cost.
As Apollo exports 35% of its products, strengthening of US Dollar vs Ringgit should result in higher profit margin.
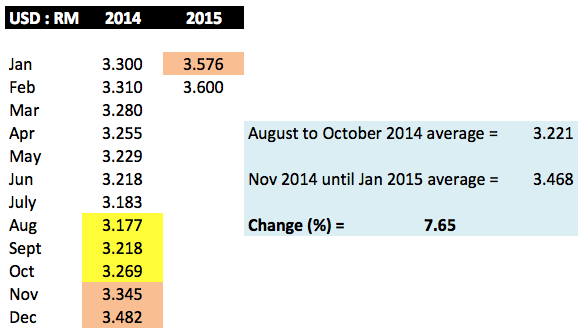
A quick check showed that average USD : RM exchange rate during the period from August until October 2014 was 3.221.
During the period from November 2014 until January 2015, the average exchange rate was 3.468.
The difference was 7.6%.
Based on my recent experience with other PLCs, weakening of Ringgit even though will boast profit margin, it would have an adverse impact on foreign currency loans and trade payables.
According to October 2014 quarterly report, the group does not have any foreign currency loan (they don't have any loan at all) and trade payable is only RM8.77 mil. As such, the depreciation of Ringgit is unlikely to give rise to material forex losses.
The group's export sales is expected to benefit from the weaker Ringgit as every US Dollar will now translate into higher Ringgit sales. Raw material price has come down in US Dollar terms. However, the weakening of Ringgit will result in higher import cost. All these factors come together will determine the group's coming quarterly results.
=======================================
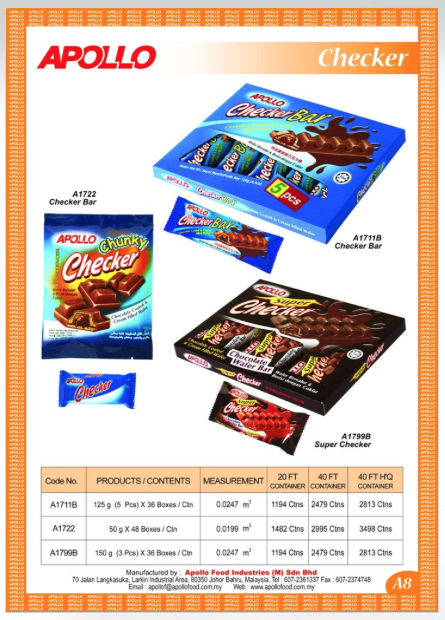
Appendix - Apollo's Products
(1) Wafer Products
Wafer products by Apollo (there are many other types)
(2) Layer Cake Products
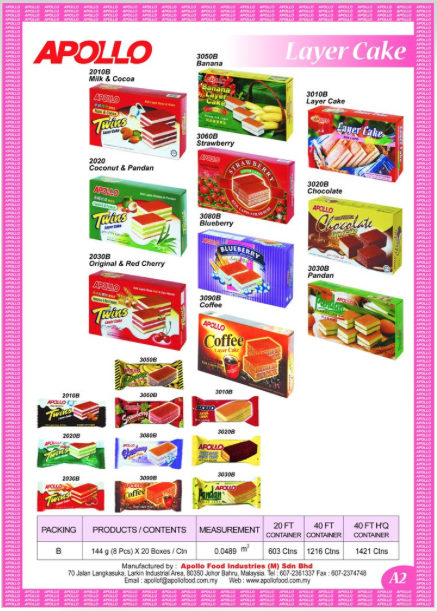
Layer cake products by Apollo (there are many other types)
(3) Swiss Roll Products
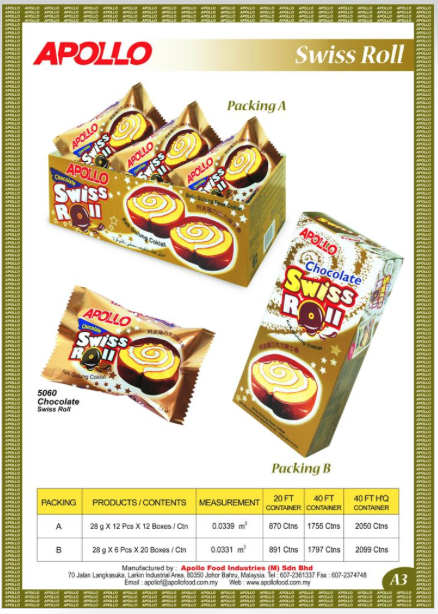
Swiss roll products by Apollo
No comments:
Post a Comment