Amtel, Censof, Cuscapi, D&O, Dataprep, Digistar, DNEX, Excel Force
Publish date: Mon, 2 Feb 2015, 08:48 PM
Amtel
Amtel Holdings Bhd (AMT) Snapshot
Open
0.85
|
Previous Close
1.00
| |
Day High
1.00
|
Day Low
0.80
| |
52 Week High
01/9/15 - 1.00
|
52 Week Low
06/9/14 - 0.62
| |
Market Cap
49.3M
|
Average Volume 10 Days
5.0K
| |
EPS TTM
0.01
|
Shares Outstanding
49.3M
| |
EX-Date
06/5/14
|
P/E TM
73.5x
| |
Dividend
0.04
|
Dividend Yield
4.30%
|
| F.Y. | Quarter | Revenue ('000) | Profit before Tax ('000) | Profit ('000) | Profit Attb. to SH ('000) | EPS (Cent) | DPS (Cent) | NAPS | |
|---|---|---|---|---|---|---|---|---|---|
| 2014-11-30 | 2014-11-30 | 9,692 | 2,190 | 1,693 | 1,804 | 3.66 | - | 0.8718 | |
| 2014-11-30 | 2014-08-31 | 7,499 | -189 | -226 | -200 | -0.41 | - | 0.8382 | |
| 2014-11-30 | 2014-05-31 | 8,672 | -436 | -440 | -428 | -0.87 | - | 0.8822 | |
| 2014-11-30 | 2014-02-28 | 6,525 | -502 | -538 | -524 | -1.06 | - | 0.8910 | |
| 2013-11-30 | 2013-11-30 | 8,810 | -110 | -136 | -191 | -0.39 | - | - | |
| 2013-11-30 | 2013-08-31 | 9,707 | 330 | 189 | 195 | 0.40 | - | 0.9051 | |
| 2013-11-30 | 2013-05-31 | 10,438 | 688 | 620 | 555 | 1.13 | - | 0.9390 | |
| 2013-11-30 | 2013-02-28 | 11,494 | 968 | 599 | 525 | 1.07 | - | 0.9278 |
Amtel Holdings Berhad was incorporated on 9 November 1996 and was listed on the Second Board of Bursa Malaysia Securities Berhad on 26 November 1997. The principal activities of the Company are investment holding and the provision of management services whilst the Group is mainly involved in the following :-
01.Distribution of telematics products and trading of electronic and telecommunications related products;
02.Trading and servicing of two way radio communications products and telecommunications related products;
03.Development of geographical information systems, navigation mapping and softwares and related products;
04.Contractors for installation, jointing and testing of utilities, telecommunication and
fibre optic cables and associated civil works; and
05.Property investment and investment holding.
|
Comments - latest quarter profit due to "other income". Yet to turnaround.
======================================================================
Censof Holdings
Censof Holdings Bhd (CSHB) Snapshot
Open
0.51
|
Previous Close
0.50
| |
Day High
0.51
|
Day Low
0.49
| |
52 Week High
10/9/14 - 0.67
|
52 Week Low
12/16/14 - 0.29
| |
Market Cap
221.3M
|
Average Volume 10 Days
8.2M
| |
EPS TTM
0.0030
|
Shares Outstanding
451.7M
| |
EX-Date
09/12/13
|
P/E TM
163.3x
| |
Dividend
--
|
Dividend Yield
--
|
| F.Y. | Quarter | Revenue ('000) | Profit before Tax ('000) | Profit ('000) | Profit Attb. to SH ('000) | EPS (Cent) | DPS (Cent) | NAPS | |
|---|---|---|---|---|---|---|---|---|---|
| 2015-03-31 | 2014-09-30 | 32,625 | 5,194 | 2,016 | -534 | 0.13 | - | 0.2859 | |
| 2015-03-31 | 2014-06-30 | 31,524 | 6,716 | 5,015 | 1,710 | 0.43 | - | 0.2417 | |
| 2014-03-31 | 2014-03-31 | 30,250 | 4,284 | 2,972 | 1,318 | 0.36 | - | 0.2456 | |
| 2014-03-31 | 2013-12-31 | 17,717 | -2,846 | -3,049 | -3,420 | -0.97 | - | 0.2168 | |
| 2013-12-31 | 2013-09-30 | 7,647 | 1,349 | 1,230 | 1,131 | 0.33 | - | 0.2291 | |
| 2013-12-31 | 2013-06-30 | 14,206 | 768 | 737 | 539 | 0.16 | - | 0.1952 | |
| 2013-12-31 | 2013-03-31 | - | - | - | - | - | - | - | |
| 2012-12-31 | 2012-12-31 | 17,858 | 5,088 | 4,885 | 4,607 | 1.42 | - | 0.1871 | |
| 2012-12-31 | 2012-09-30 | 5,328 | 1,680 | 1,678 | 1,780 | 0.49 | - | 17.5000 | |
| 2012-12-31 | 2012-06-30 | 13,274 | 1,106 | 1,103 | 1,087 | 0.32 | - | 0.1695 | |
| 2012-12-31 | 2012-03-31 | 8,523 | 2,024 | 2,015 | 2,032 | 0.59 | - | 0.1700 |

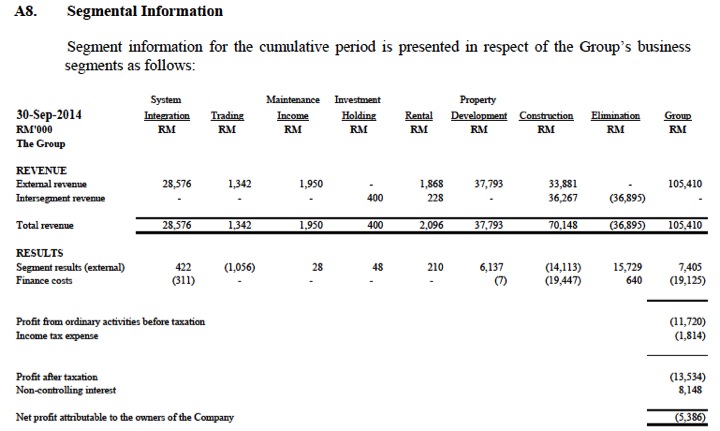
Comments - largest contributor to PBT is National Single Window due to its 45% stake in Time Engineering Bhd (acquired in 2014 from Khazanah at 20 sen per share or RM69.8 mil, renamed Dagang NexChange Bhd, DNEX).
However, after hefty interest expenses and deduction of minority interest, Censof group's latest quarter reported small loss of RM0.5 mil.
In July 2014, Censof disposed of 45 mil DNEX shares (5.8% equity interest) at 28 sen per share for RM12 mil to pare down borrowings. Censof still holds 39.2% of DNEX.
DNEX's concession will expire in September 2016 and is subject to renewal.
Censof recently entered into 50% JV with Asian Business Solutions Sdn Bhd for marketing of GST related software.
Concluding Remarks - Market cap of RM221 mil is quite huge. Potential re rating if (1) DNEX concession extended beyond 2016 (2) GST software sales perform well.
============================================================================================
Cuscapi
Cuscapi Bhd (CUSC) Snapshot
Open
0.18
|
Previous Close
0.18
| |
Day High
0.18
|
Day Low
0.18
| |
52 Week High
02/19/14 - 0.46
|
52 Week Low
12/16/14 - 0.13
| |
Market Cap
78.4M
|
Average Volume 10 Days
476.3K
| |
EPS TTM
-0.02
|
Shares Outstanding
435.5M
| |
EX-Date
03/27/13
|
P/E TM
--
| |
Dividend
--
|
Dividend Yield
--
|
Quarter Result:
| F.Y. | Quarter | Revenue ('000) | Profit before Tax ('000) | Profit ('000) | Profit Attb. to SH ('000) | EPS (Cent) | DPS (Cent) | NAPS | |
|---|---|---|---|---|---|---|---|---|---|
| 2014-12-31 | 2014-09-30 | 11,628 | -3,853 | -3,877 | -3,901 | -0.90 | - | 0.1900 | |
| 2014-12-31 | 2014-06-30 | 13,768 | -3,209 | -3,221 | -3,315 | -0.76 | - | 0.1900 | |
| 2014-12-31 | 2014-03-31 | 13,311 | 379 | 357 | 424 | 0.10 | - | 0.2000 | |
| 2013-12-31 | 2013-12-31 | 12,394 | -483 | -1,747 | -1,788 | -0.41 | - | 0.2300 | |
| 2013-12-31 | 2013-09-30 | 9,710 | -2,647 | -2,798 | -2,798 | -0.65 | - | 0.2500 | |
| 2013-12-31 | 2013-06-30 | 14,379 | 374 | 371 | 371 | 0.10 | - | 0.3000 | |
| 2013-12-31 | 2013-03-31 | 11,772 | 626 | 595 | 595 | 0.24 | 1.50 | 0.2500 | |
| 2012-12-31 | 2012-12-31 | 14,177 | 1,721 | 1,632 | 1,632 | 0.67 | - | - | |
| 2012-12-31 | 2012-09-30 | 14,492 | 1,137 | 1,109 | 1,109 | 0.45 | - | 0.2500 | |
| 2012-12-31 | 2012-06-30 | 19,442 | 3,103 | 3,080 | 3,080 | 1.26 | - | 0.2400 | |
| 2012-12-31 | 2012-03-31 | 12,128 | 619 | 567 | 567 | 0.23 | 1.50 | 0.2300 |
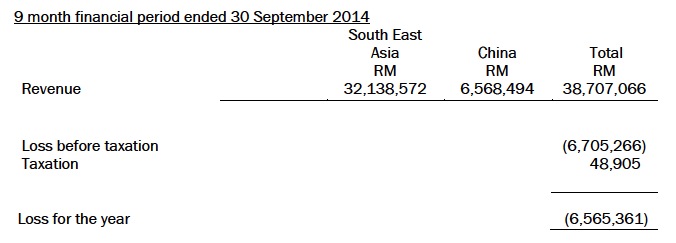
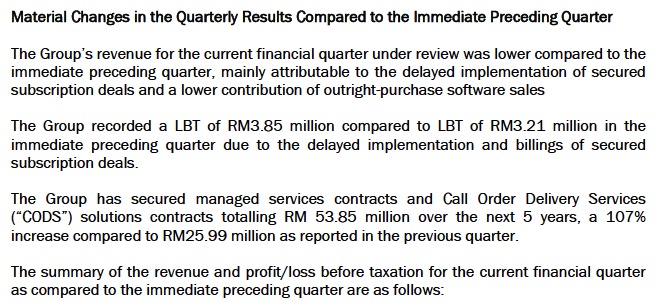
Comments - The growth story for this group has been widely publicised. However, persistent failure to delivery profit from its secured orders disappointed investors. As a result, share price has declined substantially from 40 sen to 15 sen.
Management needs to deliver results in coming quarters to regain investors' confidence.
=================================================================================
D&O Green Technologies
D&O Green Technologies Bhd (DOGT) Snapshot
Open
0.24
|
Previous Close
0.25
| |
Day High
0.24
|
Day Low
0.23
| |
52 Week High
05/26/14 - 0.42
|
52 Week Low
12/15/14 - 0.21
| |
Market Cap
224.9M
|
Average Volume 10 Days
47.2K
| |
EPS TTM
0.0020
|
Shares Outstanding
977.6M
| |
EX-Date
07/3/09
|
P/E TM
116.0x
| |
Dividend
--
|
Dividend Yield
--
|
Quarter Result:
| F.Y. | Quarter | Revenue ('000) | Profit before Tax ('000) | Profit ('000) | Profit Attb. to SH ('000) | EPS (Cent) | DPS (Cent) | NAPS | |
|---|---|---|---|---|---|---|---|---|---|
| 2014-12-31 | 2014-09-30 | 105,952 | 680 | 472 | 708 | 0.07 | - | 0.1350 | |
| 2014-12-31 | 2014-06-30 | 125,117 | 2,096 | 1,512 | 286 | 0.03 | - | 0.1305 | |
| 2014-12-31 | 2014-03-31 | 103,667 | 979 | 194 | -427 | -0.04 | - | 0.1281 | |
| 2013-12-31 | 2013-12-31 | 108,394 | 954 | 1,402 | 701 | 0.07 | - | 0.1267 | |
| 2013-12-31 | 2013-09-30 | 100,496 | 2,738 | 2,280 | 1,506 | 0.15 | - | 0.1269 | |
| 2013-12-31 | 2013-06-30 | 72,190 | 1,481 | 1,099 | 302 | 0.03 | - | 0.1248 | |
| 2013-12-31 | 2013-03-31 | 59,842 | -727 | -1,511 | -2,069 | -0.21 | - | 0.1360 |
| Welcome to D & O Green Technologies Berhad (645371-V) website | |||||
 |
D & O Green Technologies Berhad is an investment holding and provision of management services company, listed on the Main Board of Bursa Malaysia Securities.The major business of D&O group is providing services of Original Equipment Manufacturer (OEM), Original Design Manufacturer (ODM) and Original Branding Manufacturer (OBM) in Opto semiconductor products cater for automotive, general lighting, backlight unit and sensor applications.
| ||||
| |||||
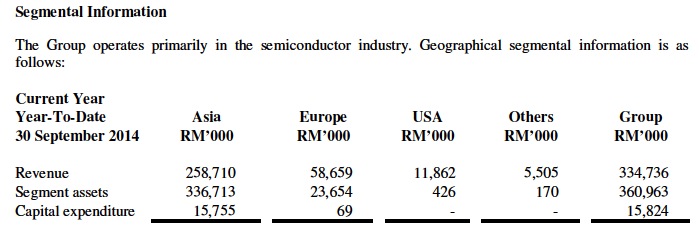
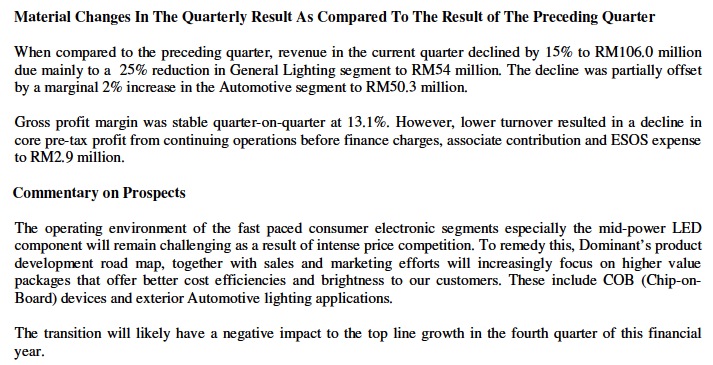
Comments - With its consistently low profitability, I am surprised with the company's huge RM225 mil market cap. The group is principally involved in production of LEDs, which is currently facing intense competition from China based manufacturers.
============================================================================================
Dataprep
Dataprep Holdings Bhd (DATA) Snapshot
Open
0.19
|
Previous Close
0.19
| |
Day High
0.22
|
Day Low
0.19
| |
52 Week High
08/21/14 - 0.31
|
52 Week Low
12/15/14 - 0.17
| |
Market Cap
80.4M
|
Average Volume 10 Days
214.8K
| |
EPS TTM
-0.01
|
Shares Outstanding
383.1M
| |
EX-Date
09/7/95
|
P/E TM
--
| |
Dividend
--
|
Dividend Yield
--
|
Quarter Result:
| F.Y. | Quarter | Revenue ('000) | Profit before Tax ('000) | Profit ('000) | Profit Attb. to SH ('000) | EPS (Cent) | DPS (Cent) | NAPS | |
|---|---|---|---|---|---|---|---|---|---|
| 2015-03-31 | 2014-09-30 | 18,888 | 435 | 398 | 201 | 0.05 | - | 0.0900 | |
| 2015-03-31 | 2014-06-30 | 12,182 | -1,831 | -1,831 | -1,880 | -0.49 | - | 0.0900 | |
| 2014-03-31 | 2014-03-31 | 21,715 | -387 | -497 | -825 | -0.22 | - | 0.0900 | |
| 2014-03-31 | 2013-12-31 | 9,550 | -1,589 | -1,598 | -1,750 | -0.46 | - | 0.0900 | |
| 2014-03-31 | 2013-09-30 | 10,221 | -1,782 | -1,789 | -1,756 | -0.46 | - | 0.1000 | |
| 2014-03-31 | 2013-06-30 | 13,389 | -733 | -753 | -762 | -0.20 | - | 0.1000 | |
| 2013-03-31 | 2013-03-31 | 17,892 | -815 | -821 | -567 | -0.15 | - | 0.1000 |
Overview
Dataprep Holdings Bhd (DHB) has the distinction of being the first Malaysian IT company to be listed on the Kuala Lumpur Stock Exchange (now known as Bursa Malaysia Securities Berhad) in 1991. A pioneer in the industry, DHB together with its subsidiaries have accumulated 43 years of IT experience collectively.
An IT (Information Technology) service provider, the Dataprep Group offers a full spectrum of ICT services to a range of customers in various industries, among them government, education, telecommunication and financial services and products.
|
Comment - The group is loss making.
=====================================================================================
Digistar
Digistar Corp Bhd (DICB) Snapshot
Open
0.23
|
Previous Close
0.23
| |
Day High
0.23
|
Day Low
0.23
| |
52 Week High
07/9/14 - 0.35
|
52 Week Low
12/1/14 - 0.20
| |
Market Cap
104.9M
|
Average Volume 10 Days
1.2M
| |
EPS TTM
-0.0084
|
Shares Outstanding
456.0M
| |
EX-Date
04/19/10
|
P/E TM
--
| |
Dividend
--
|
Dividend Yield
--
|
Quarter Result:
| F.Y. | Quarter | Revenue ('000) | Profit before Tax ('000) | Profit ('000) | Profit Attb. to SH ('000) | EPS (Cent) | DPS (Cent) | NAPS | |
|---|---|---|---|---|---|---|---|---|---|
| 2014-09-30 | 2014-09-30 | 60,480 | -15,585 | -15,988 | -7,885 | -1.87 | - | 0.1776 | |
| 2014-09-30 | 2014-06-30 | 17,320 | 1,662 | 1,292 | 1,334 | 0.66 | - | 0.1963 | |
| 2014-09-30 | 2014-03-31 | 19,336 | 1,938 | 897 | 900 | 0.28 | - | 0.1935 | |
| 2014-09-30 | 2013-12-31 | 8,274 | 265 | 265 | 265 | 0.09 | - | 0.1909 | |
| 2013-09-30 | 2013-09-30 | 233 | -18,275 | -16,708 | -16,124 | -3.67 | - | - | |
| 2013-09-30 | 2013-06-30 | 11,222 | 498 | 123 | 152 | 0.05 | - | 0.2369 | |
| 2013-09-30 | 2013-03-31 | 18,268 | 2,209 | 1,980 | 1,951 | 0.79 | - | 0.2534 | |
| 2013-09-30 | 2012-12-31 | 18,565 | 3,701 | 3,166 | 3,195 | 1.29 | - | 0.2454 | |
| 2012-09-30 | 2012-09-30 | 12,809 | -518 | -1,270 | -1,281 | -0.56 | - | - | |
| 2012-09-30 | 2012-06-30 | 13,361 | 2,117 | 1,389 | 1,389 | 0.62 | - | 0.2858 | |
| 2012-09-30 | 2012-03-31 | 17,777 | 2,884 | 2,071 | 2,071 | 0.92 | - | 0.2810 | |
| 2012-09-30 | 2011-12-31 | 21,946 | 5,473 | 3,941 | 3,941 | 1.74 | - | 0.2716 | |
| 2011-09-30 | 2011-09-30 | 21,838 | 6,048 | 4,431 | 4,510 | 2.11 | - | - | |
| 2011-09-30 | 2011-06-30 | 24,855 | 7,648 | 6,002 | 6,002 | 2.88 | - | 0.2244 | |
| 2011-09-30 | 2011-03-31 | 23,569 | 6,118 | 4,569 | 4,569 | 2.31 | - | 0.2009 | |
| 2011-09-30 | 2010-12-31 | 27,567 | 6,179 | 4,448 | 4,448 | 2.38 | - | 0.1827 | |
| 2010-09-30 | 2010-09-30 | 24,205 | 4,577 | 2,197 | 2,197 | 1.18 | - | - | |
| 2010-09-30 | 2010-06-30 | 19,309 | 1,301 | 1,143 | 1,143 | 0.62 | - | 0.1472 |
Digistar was established in 1982 and is listed in the Malaysia stock exchange in 2003. The Company started as a system house, specialising in design and installation of communication systems. Today, the company is divided into 6 divisions: IPTV & E-commerce, Telecommunication & Information Technology, Total Security System, Broadcast Engineering (Local), Property & Construction, Broadcast Engineering (Overseas)Digistar has a strong reputation for its experience and reliability in designing, supplying, supervising and installing quality and specialised service systems as mentioned above. With it proven track record and versatility in the industry, the group is able to design and install systems that meet client's requirements while reducing cost without compromising on quality.
Backed by qualified and experienced engineers, Digistar has the capabilities to meet even the most complicated demands. Technology for the broadcasting industry has grown tremendously over the past few years. By year 2015, all broadcast television stations around the world will be required to switch from analogue to digital television.
Also, the response to HD and 3D technology has been overwhelming which is changing the landscape of the industry. This development gave rise to many potential opportunities and Digistar is determined to play part in it |  |
Comments - Digistar used to do well in 2011 and 2012. However, following decline in profitability in ICT division, the group has ventured into property development and construction businesses. The diversification strategy has apparently yet to bear fruits as the group is still in the red.
The group has high borrowings. As at 30 September 2014, net assets, bonds and cash is RM74 mil, RM260 mil and RM220 mil respectively.
I have not conducted a detailed study of the group. But based on its P&L and Balance Sheets, the stock doesn't look very appealing at this juncture.
====================================================================================
Dagang Nexchange Bhd
Dagang Nexchange Bhd (DNEX) Snapshot
Open
0.33
|
Previous Close
0.32
| |
Day High
0.33
|
Day Low
0.32
| |
52 Week High
10/31/14 - 0.41
|
52 Week Low
12/16/14 - 0.23
| |
Market Cap
252.0M
|
Average Volume 10 Days
24.8M
| |
EPS TTM
-0.0006
|
Shares Outstanding
775.2M
| |
EX-Date
06/18/13
|
P/E TM
--
| |
Dividend
--
|
Dividend Yield
--
|
Quarter Result:
| F.Y. | Quarter | Revenue ('000) | Profit before Tax ('000) | Profit ('000) | Profit Attb. to SH ('000) | EPS (Cent) | DPS (Cent) | NAPS | |
|---|---|---|---|---|---|---|---|---|---|
| 2014-12-31 | 2014-09-30 | 21,668 | 6,360 | 3,294 | 2,441 | 0.31 | - | 0.1100 | |
| 2014-12-31 | 2014-06-30 | 20,592 | 6,510 | 4,811 | 3,572 | 0.46 | - | 0.1000 | |
| 2014-12-31 | 2014-03-31 | 18,596 | 4,624 | 3,242 | 1,936 | 0.25 | - | 0.1000 | |
| 2013-12-31 | 2013-12-31 | 20,125 | -6,977 | -8,087 | -8,383 | -1.08 | - | 0.1000 | |
| 2013-12-31 | 2013-09-30 | 20,232 | 3,793 | 2,053 | 90 | 0.01 | - | 0.1100 | |
| 2013-12-31 | 2013-06-30 | 24,904 | 4,896 | 3,821 | 1,801 | 0.23 | - | 0.1100 | |
| 2013-12-31 | 2013-03-31 | 20,539 | 2,192 | 2,192 | 521 | 0.07 | - | 0.1300 | |
| 2012-12-31 | 2012-12-31 | 69,860 | 7 | -1,044 | -1,897 | -0.24 | - | - | |
| 2012-12-31 | 2012-09-30 | 33,560 | -2,241 | -3,541 | -4,684 | -0.60 | - | 0.1400 | |
| 2012-12-31 | 2012-06-30 | 25,916 | 904 | 652 | -745 | -0.10 | - | 0.1400 | |
| 2012-12-31 | 2012-03-31 | 15,258 | 1,444 | 767 | -453 | -0.06 | - | 0.1700 |
Dnex is the operator of Dagang Net. The Malaysian Government visualised the National Single Window (NSW) as an electronic approach to facilitate trade and increase efficiency of the Government delivery system. Currently, the 5 core services under the NSW are:
Ref
|
Services
|
Sender
|
Recipient
|
1
| Electronic Customs Declarations |
· Importers/Exporters
· Forwarding Agents
|
· Customs
|
2
| Electronic Duty Payment |
· Importers/Exporters
· Forwarding Agents
|
· Customs
· Banks
|
3
| Electronic Manifests |
· Freight Forwarders
· Shipping Agents
|
· Customs
· Free Zone Authority (FZA)
· Port Operator
|
4
| Electronic Permits |
· Importers/Exporters
· Forwarding Agents
|
· Permit Issuing Agencies (PIAs)
· Customs
|
5.
| Electronic Preferential Certificates of Origin |
· Importers/Exporters
· Forwarding Agents
|
· Ministry of International Trade & Industry (MITI)
|
Comments - Previously known as Time Engineering, Dnex was taken over by Censof via acquisition of a controlling stake in early 2014.
Dnex holds a concession to act as service provider for international trade related transactions for the government. The concession will expire by September 2016 and is subject to renewal.
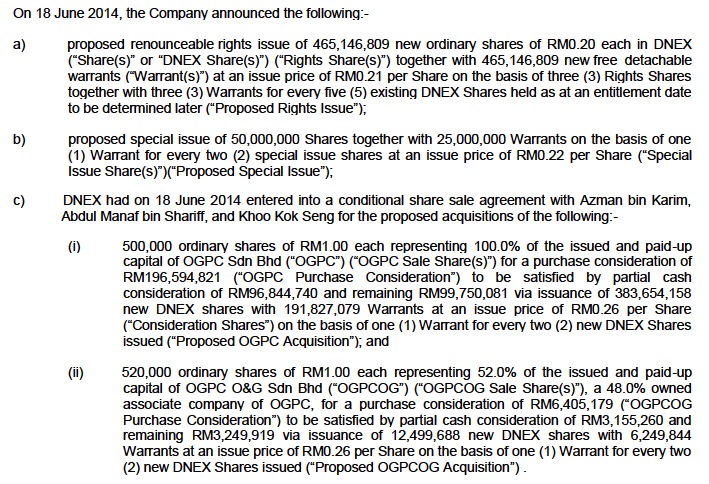
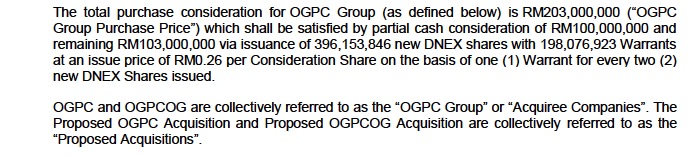
In June 2014, Dnex announced proposed rights issue and acquisition of oil and gas businesses. The oil and gas business generated net profit of approximately RM20 mil. It is principally involved in provision of valves, heating systems, pumps and compressors to oil and gas and petrochemical companies. The proposals are pending completion.
The proposals used to generate a lot of excitement. However, the recent softening of oil prices has cast doubt on the prospects of oil and gas service providers.
At current price, Dnex is already trading at PE multiple of more than 20 times. After rights issue and acquisition (involved issuance of new shares), share cap will further balloon.
==================================================================
Excel Force MSC Bhd
Excel Force Msc Bhd (EFM) Snapshot
Open
0.62
|
Previous Close
0.62
| |
Day High
0.63
|
Day Low
0.62
| |
52 Week High
07/4/14 - 0.96
|
52 Week Low
12/16/14 - 0.49
| |
Market Cap
129.2M
|
Average Volume 10 Days
490.9K
| |
EPS TTM
0.04
|
Shares Outstanding
206.8M
| |
EX-Date
12/4/14
|
P/E TM
16.2x
| |
Dividend
0.03
|
Dividend Yield
4.00%
|
Quarter Result:
| F.Y. | Quarter | Revenue ('000) | Profit before Tax ('000) | Profit ('000) | Profit Attb. to SH ('000) | EPS (Cent) | DPS (Cent) | NAPS | |
|---|---|---|---|---|---|---|---|---|---|
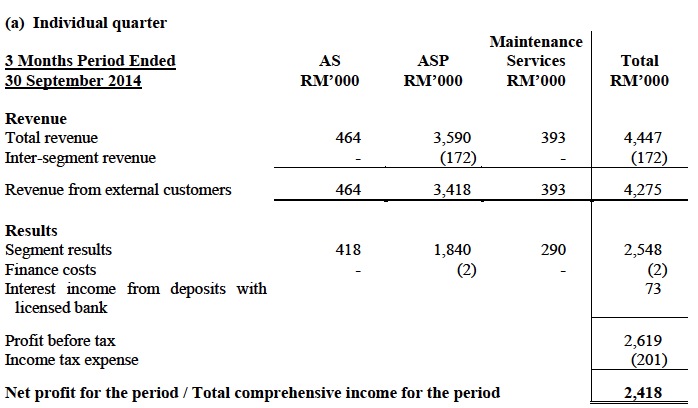
| 2014-12-31 | 2014-09-30 | 4,275 | 2,619 | 2,418 | 2,384 | 1.15 | - | 0.2100 | |
| 2014-12-31 | 2014-06-30 | 5,823 | 2,689 | 2,067 | 2,007 | 0.97 | 1.50 | 0.1900 | |
| 2014-12-31 | 2014-03-31 | 5,819 | 2,844 | 2,154 | 2,121 | 1.03 | 1.50 | 0.1800 | |
| 2013-12-31 | 2013-12-31 | 5,462 | 1,905 | 1,459 | 1,472 | 0.71 | - | 0.1900 | |
| 2013-12-31 | 2013-09-30 | 4,812 | 2,221 | 1,618 | 1,608 | 0.78 | 2.50 | 0.1800 | |
| 2013-12-31 | 2013-06-30 | 4,399 | 1,617 | 1,218 | 1,251 | 0.60 | 1.50 | 0.2000 | |
| 2013-12-31 | 2013-03-31 | 5,953 | 3,546 | 2,662 | 2,670 | 1.29 | - | 0.2100 | |
| 2012-12-31 | 2012-12-31 | 4,795 | 922 | 567 | 596 | 0.29 | - | - | |
| 2012-12-31 | 2012-09-30 | 3,664 | 921 | 572 | 569 | 0.28 | - | 0.1900 | |
| 2012-12-31 | 2012-06-30 | 5,003 | 2,045 | 2,031 | 2,068 | 1.00 | 1.00 | 0.1900 | |
| 2012-12-31 | 2012-03-31 | 4,899 | 2,036 | 2,016 | 2,024 | 0.98 | - | 0.1900 |
From The Company's Website
Established in 1994, Excel Force MSC Berhad (EFORCE) is currently the market leader in Malaysia for the provision of financial services business solutions. Over the years, we have attained approximately 90% of stock broking Public Gallery Display System and 70% of Electronic Client Ordering System market share in Malaysia.

Comments - One of the group's strong point is that the bulk of its revenue and earnings is from provision of outsourcing service which is recurrent in nature. As revenue is tied to trading volume, the group should do particularly well durnig bull market. Over the longer term, as Malaysia's equity capital market grows, the group's revenue and earnings will rise accordingly. It is truly a proxy to Malaysia's stock market, minus the risk associated with stock broking businesses (client defaults, etc).
Based on cumulative 12 months net profit of RM8 mil and market cap of RM129 mil, the stock is trading at PER of 16 times. The company has been consistently paying out dividend with current yield at approximately 4%.
This is a good company that deserves further attention.
No comments:
Post a Comment