ETI Tech, GHL, Grand-Flo, Key Asic, Kobay, Mesiniaga
Publish date: Tue, 3 Feb 2015, 02:40 PM
ETI Tech
Quarter Result:
From The Company's Website
ETI Tech Corporation Bhd, stock code (0118) is an investment holding company listed on the Main Market of Bursa Malaysia on 20 April, 2010, while its wholly-owned subsidiary, ETI Tech (M) Sdn Bhd, an MSC Status Company, is principally involved in the research and development of intelligent battery management systems for rechargeable energy storage solutions using polymer lithium-ion based energy cells for various electronic applications that require light-weight, high-powered rechargeable energy solutions in the telecommunications, healthcare, power utilities, aero models and robotics industries. ETI Tech Corporation Bhd was previously listed on the Ace Market before its transfer to the Main Market.
Comments - The group has not done well in its original battery business. In July 2014, the company sought shareholders' approval for proposed diversification into construction and property development businesses. The group managed to secure a RM70 mil contract from third party to construct an apartment building in Alor Setar, Kedah.
The group sought shareholders' approval for proposed debt restructuring in December 2014. Pursuant to the debt restructuring, Hong Leong emerged as a substantial shareholder holdiong 95 mil shares in the company.
The company is no more a technology company. For expsoure to property and construction businesses, there are many other more viable companies in Bursa.
===============================================================
GHL Systems

Quarter Result:

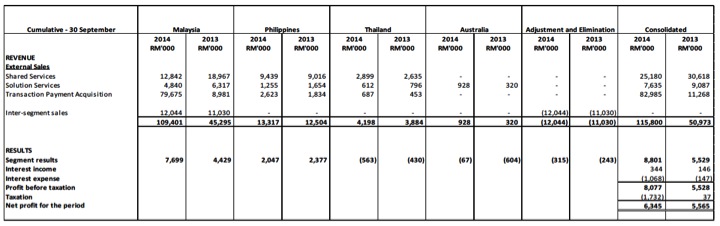
Comments - As can be seen from segmental breakdown above, revenue from Transaction Payment Acquisition jumped from RM8.98 mil in 2013 to RM79.7 mil in 2014. The huge jump was a result of the acquisition of e-Pay Asia Limited, an Australian Stock Exchange listed company by GHL in early 2014 through issuance of new GHL shares. This division is expected to be the core earnings generator for GHL going forward.
GHL's existing market cap is RM506 mil while sustainable earnings is around RM10 mil. PE multiple is more than 50 times.
================================================
Grand-Flo Berhad

Quarter Result:
Grand-Flo Berhad specializes in enterprise data collection and collation system solutions. It provides ManageSuite application solution enables users to manage and track assets in warehouses, retail outlets, and office buildings; ManageSales system, which enables management of sales force from pre-sales to post-sales; and ManageWare, a warehouse management system solution.

(barcode scanner)

(Motorola micro kiosk - capture barcode on any commercial items)
(barcode printer)


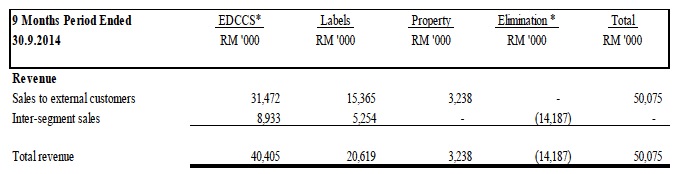
Enterprise data and collation system ("EDCCS") is the largest contributor to revenue and profit.
Comments - For FYE 31 December 2013, the group reported net profit of RM13.2 mil. However, approximately RM10.9 mil was due to gain on disposal. Meaning net profit was only approximately RM3 mil. Based on RM100 mil market cap, PE mutiple was more than 30 times.
For the 9 months ended 30 September 2014, the group reported net profit of RM5.6 mil. However, there was gain on disposal of approximately RM5.3 mil. Meaning operational net profit was only approximately RM0.3 mil only.
Based on historical performance, it seemed that the group is merely breaking even in its business operation.
=================================================================
Key Asic

Quarter Result:
Key ASIC Berhad provides low-power application-specific integrated circuit manufacturing and designing services for consumer, wireless, and personal electronic applications in Malaysia and Taiwan. The company offers data processing, data management, disk-based back-up solutions, telecommunications, office automation, network infrastructure, and intelligent storage networking support services. It also provides customer specific standard products and system-on-chip (SoC) ODM platform solutions, as well as KA 32bits CPU SoC reference platform for developing combo WiFi SD card solution.
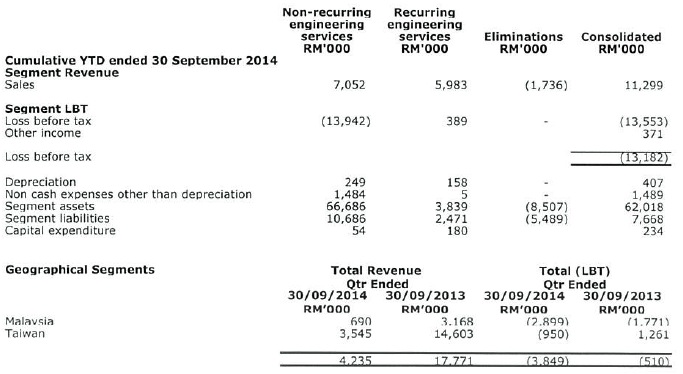
Comments - The group has been loss making for a long time. It seemed that they are not able to compete effectively in the industry. With net assets of RM50 mil, accumulated losses is more than RM80 mil. At this rate, it is a matter of time before the company will be delisted.
=================================================================
Kobay Technology

 Quarter Result:

Comments - Similar to many Malaysian based electronic related manufacturers, the group is struggling. The high profitability of Dec 2013 and Mar 2014 quarters were due to exceptional items. The group has ventured into property development as a diversification strategy.
================================================
Mesiniaga

Quarter Result:

Comments - Mesiniaga has not done well for many years. Recently, performance has deteriorated with four consecutive quarters of losses. The group seemed to have been stuck in the past. Started as one of the early major players in the IT industry, the group has been left behind in recent years by more nimble and dynamic competitors. Further tough time ahead.
Eti Tech Corp Bhd (ETIT) Snapshot
Open
0.07
|
Previous Close
0.07
| |
Day High
0.08
|
Day Low
0.06
| |
52 Week High
05/19/14 - 0.16
|
52 Week Low
12/15/14 - 0.05
| |
Market Cap
64.9M
|
Average Volume 10 Days
17.0M
| |
EPS TTM
--
|
Shares Outstanding
998.7M
| |
EX-Date
--
|
P/E TM
--
| |
Dividend
--
|
Dividend Yield
--
|
Quarter Result:
| F.Y. | Quarter | Revenue ('000) | Profit before Tax ('000) | Profit Attb. to SH ('000) | EPS (Cent) | DPS (Cent) | NAPS |
|---|---|---|---|---|---|---|---|
| 2015-07-31 | 2014-10-31 | 550 | -2,768 | -2,768 | -0.36 | - | 0.0600 |
| 2014-07-31 | 2014-07-31 | 7,558 | -5,262 | -5,262 | -0.73 | - | 0.0600 |
| 2014-07-31 | 2014-04-30 | 2,811 | 816 | 816 | 0.12 | - | 0.0600 |
| 2014-02-28 | 2014-02-28 | 2,573 | 1,139 | -781 | 1.61 | - | 0.6100 |
| 2014-02-28 | 2013-11-30 | 1,987 | -2,687 | -2,687 | -0.38 | - | 0.0600 |
| 2014-02-28 | 2013-08-31 | 10 | -2,821 | -2,759 | -0.40 | - | 0.0700 |
| 2014-02-28 | 2013-05-31 | 135 | -1,955 | -2,583 | -0.37 | - | 0.0700 |
| 2013-02-28 | 2013-02-28 | 95 | -36,382 | -36,379 | -51.51 | - | - |
| 2013-02-28 | 2012-11-30 | 514 | -13,347 | -13,347 | -1.89 | - | 0.1300 |
| 2012-08-31 | 2012-08-31 | 33,694 | -8,738 | -8,332 | -1.18 | - | 0.1400 |
| 2012-08-31 | 2012-05-31 | 14,529 | 347 | 347 | 0.05 | - | 0.1600 |
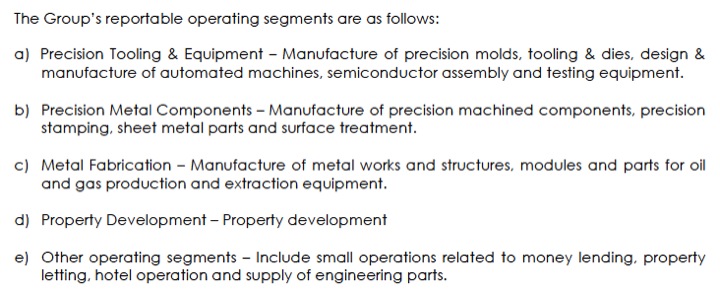
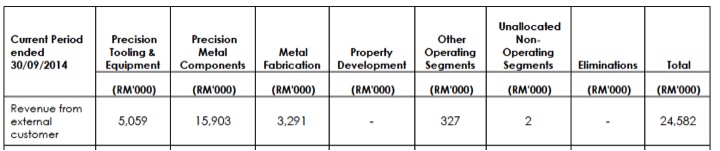
. Segmental information
Segmental reporting by industries of the Group for the current financial period to-date is set out below:-
Solar Division
RM’000
|
Construction & Property Development
RM’000
|
Others
RM’000
|
Total
RM’000
| |
| Revenue |
550
|
-
|
-
|
550
|
| Profit / (Loss) before tax |
(2,391)
|
(43)
|
(334)
|
(2,768)
|
| Total assets |
73,598
|
1,637
|
1,098
|
76,333
|
From The Company's Website
ETI Tech Corporation Bhd, stock code (0118) is an investment holding company listed on the Main Market of Bursa Malaysia on 20 April, 2010, while its wholly-owned subsidiary, ETI Tech (M) Sdn Bhd, an MSC Status Company, is principally involved in the research and development of intelligent battery management systems for rechargeable energy storage solutions using polymer lithium-ion based energy cells for various electronic applications that require light-weight, high-powered rechargeable energy solutions in the telecommunications, healthcare, power utilities, aero models and robotics industries. ETI Tech Corporation Bhd was previously listed on the Ace Market before its transfer to the Main Market.
Comments - The group has not done well in its original battery business. In July 2014, the company sought shareholders' approval for proposed diversification into construction and property development businesses. The group managed to secure a RM70 mil contract from third party to construct an apartment building in Alor Setar, Kedah.
The group sought shareholders' approval for proposed debt restructuring in December 2014. Pursuant to the debt restructuring, Hong Leong emerged as a substantial shareholder holdiong 95 mil shares in the company.
The company is no more a technology company. For expsoure to property and construction businesses, there are many other more viable companies in Bursa.
===============================================================
GHL Systems
Ghl Systems Berhad (GHLS) Snapshot
Open
0.79
|
Previous Close
0.78
| |
Day High
0.80
|
Day Low
0.78
| |
52 Week High
10/31/14 - 0.92
|
52 Week Low
02/4/14 - 0.46
| |
Market Cap
505.9M
|
Average Volume 10 Days
6.1M
| |
EPS TTM
0.01
|
Shares Outstanding
640.4M
| |
EX-Date
05/18/07
|
P/E TM
73.6x
| |
Dividend
--
|
Dividend Yield
--
|
Quarter Result:
| F.Y. | Quarter | Revenue ('000) | Profit before Tax ('000) | Profit ('000) | Profit Attb. to SH ('000) | EPS (Cent) | DPS (Cent) | NAPS | |
|---|---|---|---|---|---|---|---|---|---|
| 2014-12-31 | 2014-09-30 | 45,741 | 2,973 | 1,762 | 1,820 | 0.43 | - | 0.3945 | |
| 2014-12-31 | 2014-06-30 | 45,301 | 3,557 | 3,043 | 3,044 | 0.72 | - | 0.3880 | |
| 2014-12-31 | 2014-03-31 | 24,759 | 1,547 | 1,540 | 1,543 | 0.64 | - | 0.3805 | |
| 2013-12-31 | 2013-12-31 | 15,475 | -2,248 | -400 | -343 | -0.18 | - | 0.3040 | |
| 2013-12-31 | 2013-09-30 | 16,417 | 2,074 | 2,007 | 2,023 | 1.18 | - | 0.3066 | |
| 2013-12-31 | 2013-06-30 | 15,434 | 1,451 | 1,555 | 1,573 | 1.08 | - | 0.3075 | |
| 2013-12-31 | 2013-03-31 | 16,704 | 2,003 | 2,003 | 2,010 | 1.38 | - | 0.3019 | |
| 2012-12-31 | 2012-12-31 | 14,061 | -529 | 714 | 732 | 0.50 | - | - | |
| 2012-12-31 | 2012-09-30 | 14,607 | 981 | 906 | 906 | 0.63 | - | 0.2700 | |
| 2012-12-31 | 2012-06-30 | 12,662 | 1,172 | 1,620 | 1,620 | 1.12 | - | 0.2700 | |
| 2012-12-31 | 2012-03-31 | 12,118 | 1,111 | 1,111 | 1,111 | 0.77 | - | 0.2600 |
Comments - As can be seen from segmental breakdown above, revenue from Transaction Payment Acquisition jumped from RM8.98 mil in 2013 to RM79.7 mil in 2014. The huge jump was a result of the acquisition of e-Pay Asia Limited, an Australian Stock Exchange listed company by GHL in early 2014 through issuance of new GHL shares. This division is expected to be the core earnings generator for GHL going forward.
GHL's existing market cap is RM506 mil while sustainable earnings is around RM10 mil. PE multiple is more than 50 times.
================================================
Grand-Flo Berhad
Grand-Flo Bhd (GFLO) Snapshot
Open
0.28
|
Previous Close
0.29
| |
Day High
0.28
|
Day Low
0.28
| |
52 Week High
08/13/14 - 0.38
|
52 Week Low
12/16/14 - 0.26
| |
Market Cap
104.2M
|
Average Volume 10 Days
118.8K
| |
EPS TTM
0.02
|
Shares Outstanding
365.7M
| |
EX-Date
07/4/14
|
P/E TM
13.3x
| |
Dividend
0.01
|
Dividend Yield
3.51%
|
Quarter Result:
| F.Y. | Quarter | Revenue ('000) | Profit before Tax ('000) | Profit Attb. to SH ('000) | EPS (Cent) | DPS (Cent) | NAPS |
|---|---|---|---|---|---|---|---|
| 2014-12-31 | 2014-09-30 | 19,317 | 2,401 | 1,876 | 0.54 | - | 0.2738 |
| 2014-12-31 | 2014-06-30 | 16,557 | 265 | 177 | 0.05 | - | 0.2726 |
| 2014-12-31 | 2014-03-31 | 14,201 | 3,427 | 3,341 | 1.03 | - | 0.2760 |
| 2013-12-31 | 2013-12-31 | 29,568 | 2,404 | 1,712 | 0.53 | - | 0.2624 |
| 2013-12-31 | 2013-09-30 | 19,979 | -751 | -859 | -0.26 | - | 0.2569 |
| 2013-12-31 | 2013-06-30 | 21,191 | 10,546 | 7,991 | 2.49 | - | 0.2699 |
| 2013-12-31 | 2013-03-31 | 18,912 | 4,489 | 4,399 | 1.38 | - | 0.2471 |
| 2012-12-31 | 2012-12-31 | 23,334 | 2,352 | 1,413 | 0.48 | 1.00 | - |
| 2012-12-31 | 2012-09-30 | 22,476 | 1,570 | 1,413 | 0.48 | - | 0.2106 |
| 2012-12-31 | 2012-06-30 | 22,569 | 2,396 | 2,248 | 1.41 | - | 0.4157 |
| 2012-12-31 | 2012-03-31 | 20,366 | 2,440 | 2,215 | 1.39 | - | 0.4116 |
Grand-Flo Berhad specializes in enterprise data collection and collation system solutions. It provides ManageSuite application solution enables users to manage and track assets in warehouses, retail outlets, and office buildings; ManageSales system, which enables management of sales force from pre-sales to post-sales; and ManageWare, a warehouse management system solution.
(barcode scanner)
(Motorola micro kiosk - capture barcode on any commercial items)
(barcode printer)
ManageSales
Business is always about sales. The more sales you seal, the bigger your business grow. To achieve top sales, it is essential to manage your entire sales force effectively. From sales personnels to customer database – if you have them at your fingertips, you are already on your way to success. At Grand-Flo, we empower you with the ideal solution required known as ManageSales, a powerful sales activity system designed to increase sales and performance through data efficiency.
Designed for ease-of-use and convenience, ManageSales is a system that enables you to manage the entire sales force from pre-sales to post-sales. With ManageSales, you would be able to know the location and activity of your sales personnels while empowering them with accurate information and data so that they can seal the deal.
Vice-versa, your sales team is about to update their progress through the system so that you would have real-time data on every sales conducted. With the information and insights, the system generates a report and analysis to provide you with customer’s buying patterns and up-coming market trend.
ManageSales can be supported with mobile gadgets such as mobile barcode scanner and mobile printing with Bluetooth connectivity to provide flexibility and mobility to your sales team to perform even better. With in-depth insights, now you can make better decisions when it comes to managing your sales force and drive your business to seal more deals.
|
ManageWare
Many things happen in a warehouse. Whether it is for storage or production line, there are a lot of elements to look into when managing a warehouse including tracking stocks, managing products, receiving and delivery parcels, warehouse cycle time and customer services. We make it easy for you to gain full control of your warehouse and its development through our ManageWare solution.
ManageWare is a warehouse management system solution designed to manage every single process that takes place from the very start till the final stage of its procedures. It is a comprehensive system that streamlined the entire process from receiving to putting away, picking up to shipping off. By providing real-time accurate data and information of your warehouse including products, tools, equipments, storages and even manpower, you have better control of your warehouse. Empowered with Performance Indicator, you can now manage your warehouse efficiently without much hassle. Best of all, it allows you to go green as ManageWare is a paperless solution.
Improve operational efficiency with ManageWare and it will change the way your customers feel about your business. With a smooth operational system, you would be able to serve your customers better while increasing the productivity and performance of your business.
Smart Application
Smart Application is a collective of independant applications that is built with barcode technology on Android and Windows mobile. It enables businesses to perform more effectively and increase productivity without having to pay high prices for these applications.
These applications are able to assist especially small to medium size businesses in automating and improve manual processes such as stock take, assets tracking, goods receiving, shipping and more.
Smart Applications:
|
Enterprise data and collation system ("EDCCS") is the largest contributor to revenue and profit.
Comments - For FYE 31 December 2013, the group reported net profit of RM13.2 mil. However, approximately RM10.9 mil was due to gain on disposal. Meaning net profit was only approximately RM3 mil. Based on RM100 mil market cap, PE mutiple was more than 30 times.
For the 9 months ended 30 September 2014, the group reported net profit of RM5.6 mil. However, there was gain on disposal of approximately RM5.3 mil. Meaning operational net profit was only approximately RM0.3 mil only.
Based on historical performance, it seemed that the group is merely breaking even in its business operation.
=================================================================
Key Asic
Key Asic Bhd (KEYA) Snapshot
Open
0.10
|
Previous Close
0.10
| |
Day High
0.10
|
Day Low
0.10
| |
52 Week High
08/15/14 - 0.15
|
52 Week Low
12/23/14 - 0.05
| |
Market Cap
76.2M
|
Average Volume 10 Days
13.1K
| |
EPS TTM
-0.02
|
Shares Outstanding
802.5M
| |
EX-Date
--
|
P/E TM
--
| |
Dividend
--
|
Dividend Yield
--
|
Quarter Result:
| F.Y. | Quarter | Revenue ('000) | Profit before Tax ('000) | Profit Attb. to SH ('000) | EPS (Cent) | DPS (Cent) | NAPS |
|---|---|---|---|---|---|---|---|
| 2014-12-31 | 2014-09-30 | 4,235 | -3,849 | -3,866 | -0.48 | - | 0.0675 |
| 2014-12-31 | 2014-06-30 | 2,390 | -4,583 | -4,602 | -0.57 | - | 0.0723 |
| 2014-12-31 | 2014-03-31 | 4,675 | -4,748 | -4,769 | -0.59 | - | 0.0780 |
| 2013-12-31 | 2013-12-31 | 9,204 | -695 | -718 | -0.09 | - | 0.0845 |
| 2013-12-31 | 2013-09-30 | 17,771 | -510 | -533 | -0.07 | - | 0.0856 |
| 2013-12-31 | 2013-06-30 | 6,917 | -2,417 | -2,438 | -0.30 | - | 0.0861 |
| 2013-12-31 | 2013-03-31 | 6,303 | -3,467 | -3,499 | -0.43 | - | 0.0890 |
| 2012-12-31 | 2012-12-31 | 8,529 | -7,446 | -7,473 | -0.93 | - | - |
| 2012-12-31 | 2012-09-30 | 4,193 | -4,101 | -4,129 | -0.51 | - | 0.1023 |
| 2012-12-31 | 2012-06-30 | 6,009 | -3,405 | -3,434 | -0.43 | - | 0.1076 |
| 2012-12-31 | 2012-03-31 | 2,722 | -4,169 | -4,200 | -0.52 | - | 0.1115 |
Key ASIC Berhad provides low-power application-specific integrated circuit manufacturing and designing services for consumer, wireless, and personal electronic applications in Malaysia and Taiwan. The company offers data processing, data management, disk-based back-up solutions, telecommunications, office automation, network infrastructure, and intelligent storage networking support services. It also provides customer specific standard products and system-on-chip (SoC) ODM platform solutions, as well as KA 32bits CPU SoC reference platform for developing combo WiFi SD card solution.
Comments - The group has been loss making for a long time. It seemed that they are not able to compete effectively in the industry. With net assets of RM50 mil, accumulated losses is more than RM80 mil. At this rate, it is a matter of time before the company will be delisted.
=================================================================
Kobay Technology
Kobay Technology Bhd (KOBAY) Snapshot
Open
0.98
|
Previous Close
0.98
| |
Day High
0.98
|
Day Low
0.98
| |
52 Week High
06/17/14 - 1.29
|
52 Week Low
02/5/14 - 0.68
| |
Market Cap
65.7M
|
Average Volume 10 Days
11.8K
| |
EPS TTM
0.18
|
Shares Outstanding
67.4M
| |
EX-Date
12/29/14
|
P/E TM
5.4x
| |
Dividend
0.03
|
Dividend Yield
3.08%
|
| F.Y. | Quarter | Revenue ('000) | Profit before Tax ('000) | Profit Attb. to SH ('000) | EPS (Cent) | DPS (Cent) | NAPS |
|---|---|---|---|---|---|---|---|
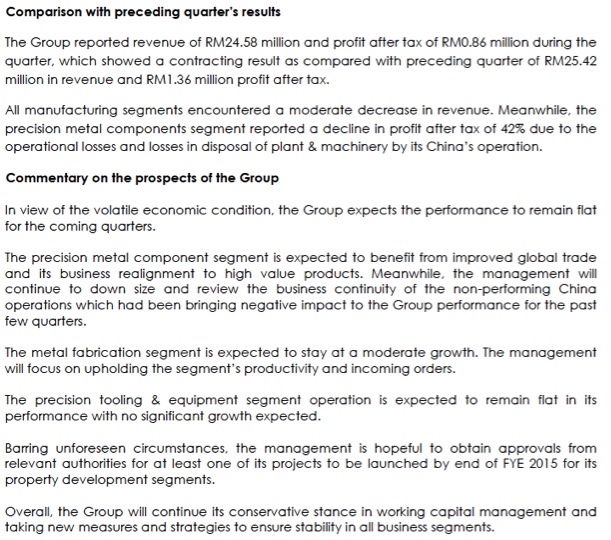
| 2015-06-30 | 2014-09-30 | 24,582 | 1,262 | 887 | 1.32 | - | 1.9300 |
| 2014-06-30 | 2014-06-30 | 25,428 | 1,132 | 1,412 | 2.10 | - | 1.9200 |
| 2014-06-30 | 2014-03-31 | 22,468 | 7,263 | 6,567 | 9.75 | - | 1.9000 |
| 2014-06-30 | 2013-12-31 | 22,525 | 3,573 | 3,255 | 4.83 | - | 1.8200 |
| 2014-06-30 | 2013-09-30 | 25,963 | 1,377 | 724 | 1.08 | - | 1.7700 |
| 2013-06-30 | 2013-06-30 | 22,451 | -512 | -513 | -0.76 | - | - |
| 2013-06-30 | 2013-03-31 | 21,508 | 226 | -25 | -0.04 | - | 1.7600 |
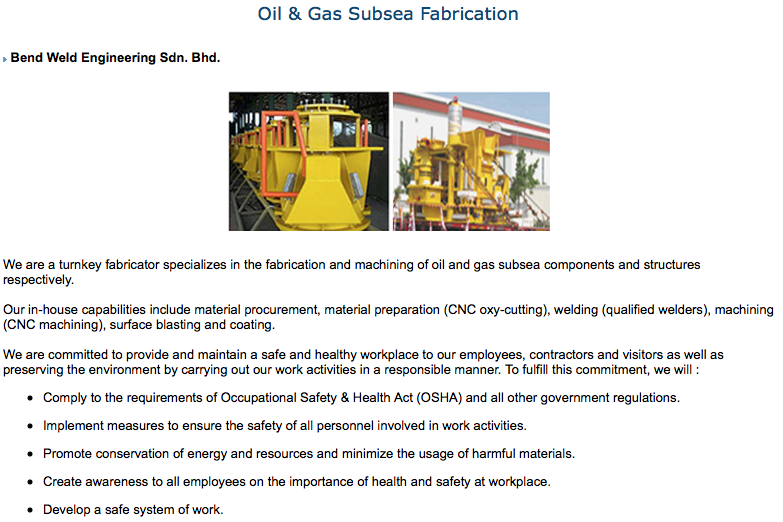
Comments - Similar to many Malaysian based electronic related manufacturers, the group is struggling. The high profitability of Dec 2013 and Mar 2014 quarters were due to exceptional items. The group has ventured into property development as a diversification strategy.
================================================
Mesiniaga
Mesiniaga Bhd (MESI) Snapshot
Open
1.61
|
Previous Close
1.59
| |
Day High
1.61
|
Day Low
1.59
| |
52 Week High
02/25/14 - 2.24
|
52 Week Low
01/29/15 - 1.57
| |
Market Cap
96.6M
|
Average Volume 10 Days
17.3K
| |
EPS TTM
-0.34
|
Shares Outstanding
60.4M
| |
EX-Date
06/19/14
|
P/E TM
--
| |
Dividend
0.10
|
Dividend Yield
6.25%
|
Quarter Result:
| F.Y. | Quarter | Revenue ('000) | Profit before Tax ('000) | Profit Attb. to SH ('000) | EPS (Cent) | DPS (Cent) | NAPS |
|---|---|---|---|---|---|---|---|
| 2014-12-31 | 2014-09-30 | 60,212 | -4,948 | -4,988 | -8.26 | - | 2.4900 |
| 2014-12-31 | 2014-06-30 | 58,641 | -3,685 | -3,651 | -6.04 | - | 2.6700 |
| 2014-12-31 | 2014-03-31 | 60,169 | -1,247 | -1,686 | -2.79 | - | 2.7300 |
| 2013-12-31 | 2013-12-31 | 69,212 | -8,004 | -10,122 | -16.76 | - | 2.7600 |
| 2013-12-31 | 2013-09-30 | 75,219 | 2,136 | 956 | 1.58 | - | 2.9200 |
| 2013-12-31 | 2013-06-30 | 63,153 | 713 | 240 | 0.40 | - | 3.0600 |
| 2013-12-31 | 2013-03-31 | 73,423 | 2,325 | 1,282 | 2.12 | - | 3.0600 |
| 2012-12-31 | 2012-12-31 | 91,096 | 6,586 | 4,772 | 7.90 | - | - |
| 2012-12-31 | 2012-09-30 | 97,524 | 2,793 | 1,320 | 2.19 | - | 2.9700 |
| 2012-12-31 | 2012-06-30 | 77,631 | 4,089 | 2,482 | 4.11 | - | 3.1000 |
| 2012-12-31 | 2012-03-31 | 58,323 | 2,140 | 1,165 | 1.93 | - | 3.0600 |
Comments - Mesiniaga has not done well for many years. Recently, performance has deteriorated with four consecutive quarters of losses. The group seemed to have been stuck in the past. Started as one of the early major players in the IT industry, the group has been left behind in recent years by more nimble and dynamic competitors. Further tough time ahead.
No comments:
Post a Comment