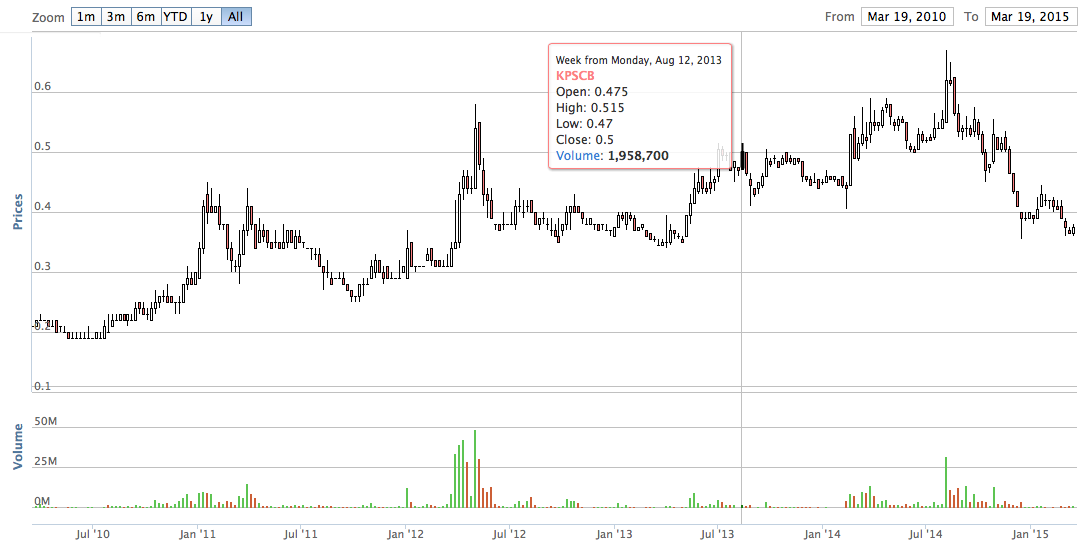
Share Price At Three Years Low, Fundamentals Intact
Author: Icon8888 | Publish date: Thu, 19 Mar 2015, 10:50 AM
NOTE : KPS Consortium is not the water company Kumpulan Perangsang Selangor
Kps Consortium Bhd (KPS) Snapshot
Open
0.37
|
Previous Close
0.37
| |
Day High
0.38
|
Day Low
0.36
| |
52 Week High
08/6/14 - 0.67
|
52 Week Low
12/16/14 - 0.36
| |
Market Cap
55.4M
|
Average Volume 10 Days
187.0K
| |
EPS TTM
-0.0059
|
Shares Outstanding
147.8M
| |
EX-Date
07/21/14
|
P/E TM
--
| |
Dividend
0.02
|
Dividend Yield
5.33%
|
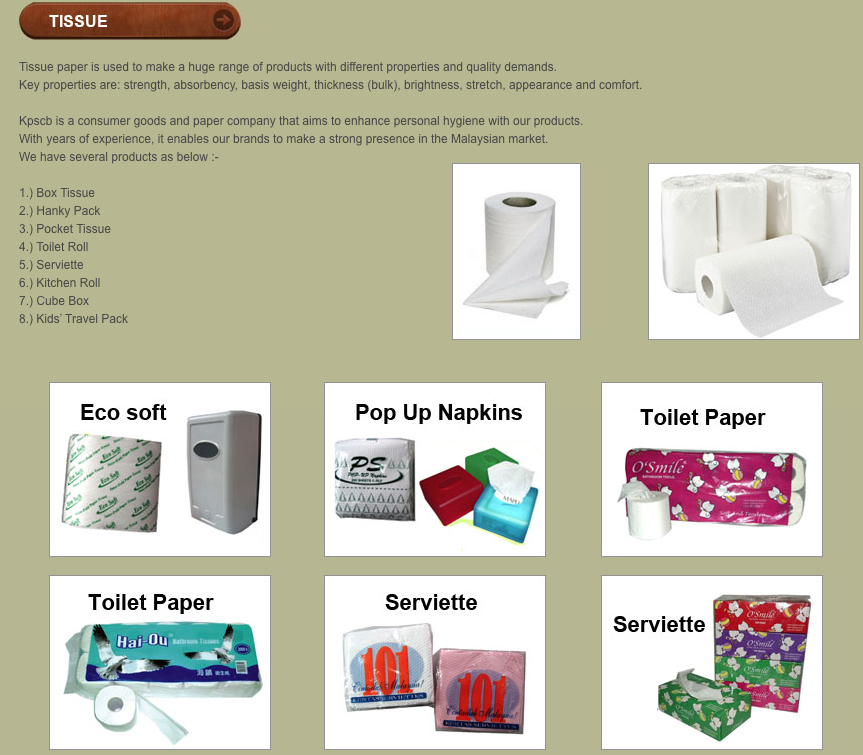
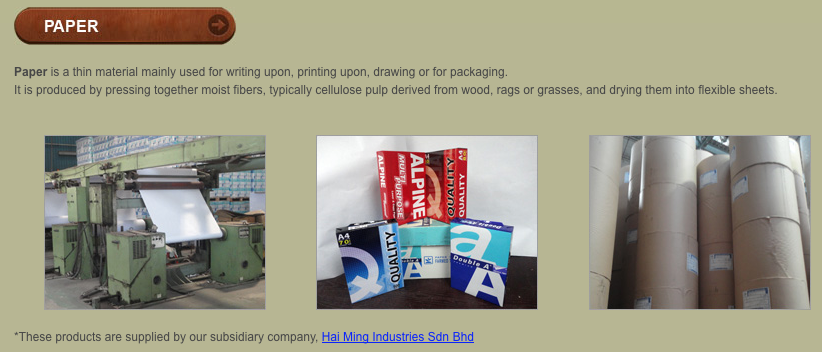
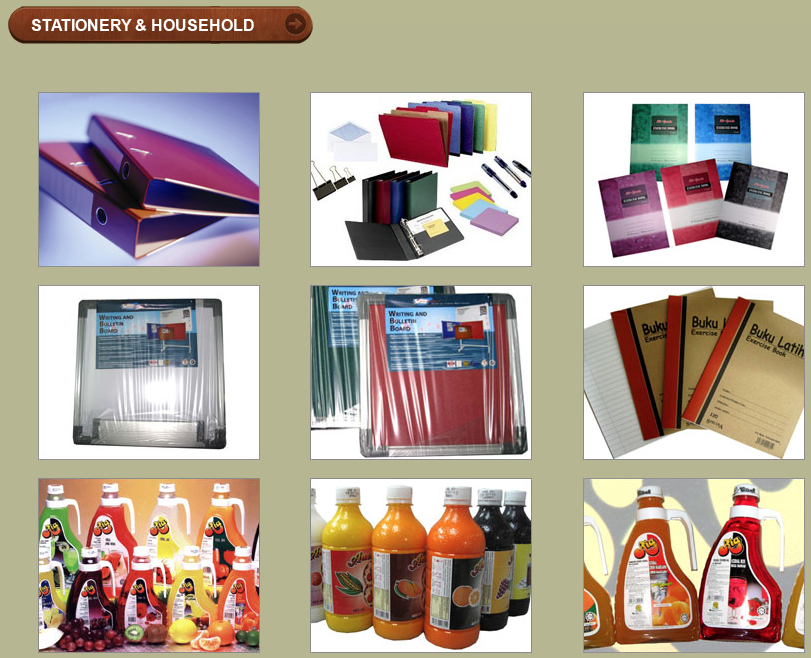
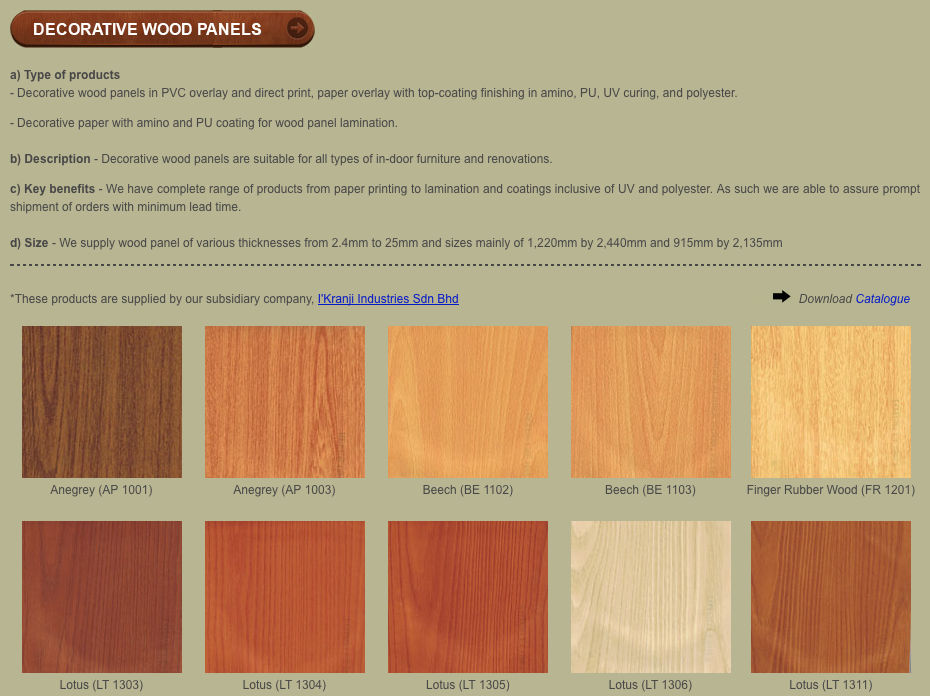
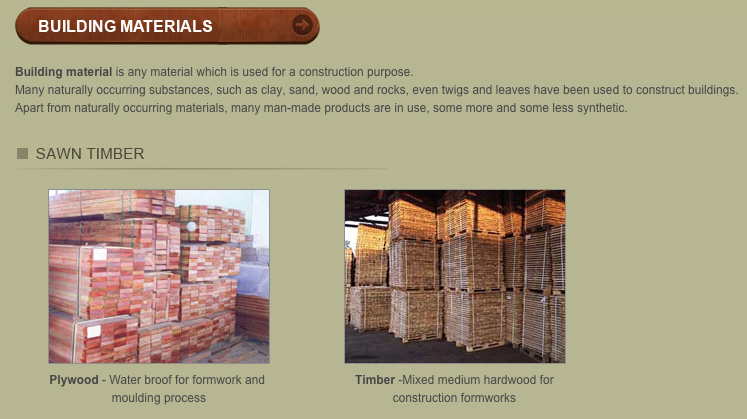
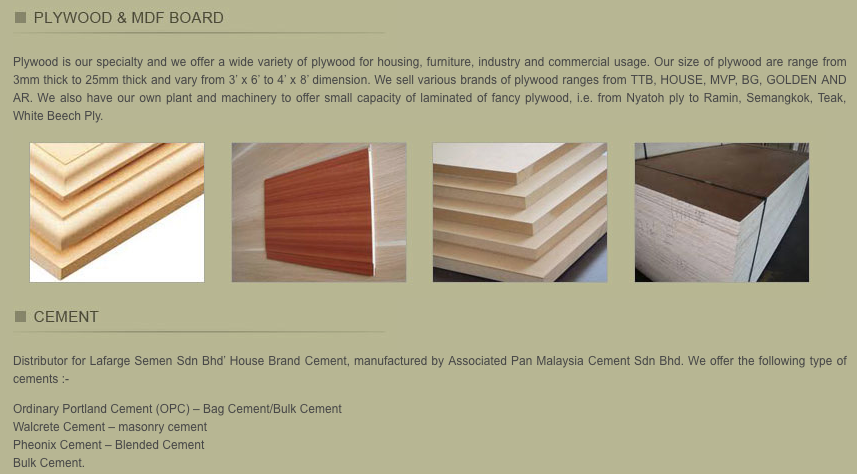
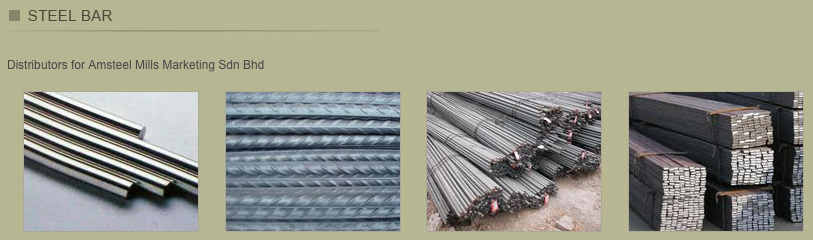
KPS Consortium is engaged in the manufacturing of paper products (similar products offering as NTPM) and trading of wooden doors, plywood, and related building materials in Malaysia and internationally.
KPS Consortium Berhad is based in Klang, Malaysia.
The group has healthy balance sheets. With net assets of RM203 mil, cash of RM27.6 mil and loans of RM81.3 mil, net gearing is 0.26 times only.
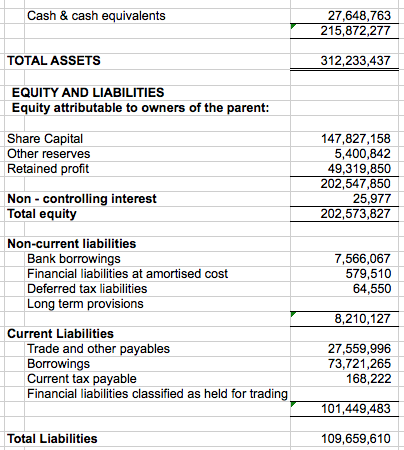
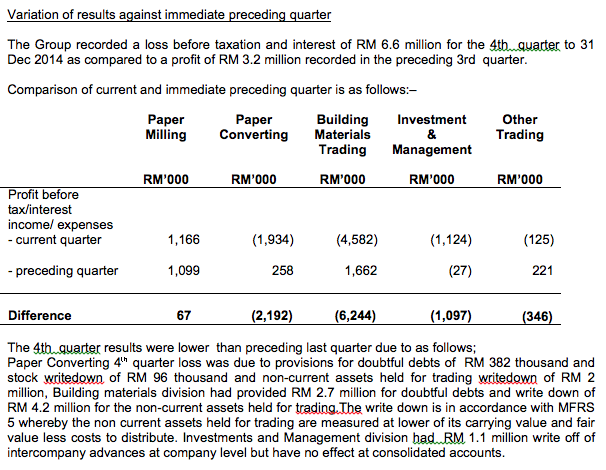
KPSCB has a consistent profit track record. The latest quarter losses was due to provision for doubtful debts and inventory write down amounting to RM9.4 mil. Hopefully these items are one off and won't recur in coming quarters.
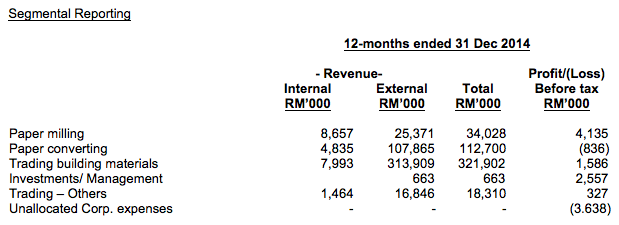
Due to the exceptional items, the group reported a loss of RM0.87 mil in FY2014. As such, PE valuation is not applicable for this particular year.
For discussion purpose, if the exceptional items are excluded, FY2014 net profit will be RM8.52 mil (being RM1.73 mil + RM2.42 mil + RM1.60 mil - RM6.63 mil + RM9.40 mil). Based on market cap of RM55 mil, historical PER would be 6.5 times.
Management's comments on latest quarter results :-
Annual Result:
| F.Y. | Revenue ('000) | Profit Attb. to SH ('000) | EPS (Cent) | PE | DPS (Cent) | DY | NAPS | ROE (%) | |
|---|---|---|---|---|---|---|---|---|---|
| TTM | 464,654 | -871 | -0.59 | - | - | - | 1.3700 | - | |
| 2014-12-31 | 464,654 | -871 | -0.59 | - | - | - | 1.3700 | - | |
| 2013-12-31 | 492,649 | 11,638 | 7.87 | 5.72 | - | - | 1.3800 | 5.70 | |
| 2012-12-31 | 457,804 | 10,223 | 6.92 | 5.35 | - | - | 1.2900 | 5.36 | |
| 2011-12-31 | 379,428 | 14,350 | 9.71 | 3.20 | - | - | 1.2100 | 8.02 | |
| 2010-12-31 | 375,041 | 14,088 | 9.53 | 3.15 | - | - | 1.1100 | 8.59 |
Quarter Result:
| F.Y. | Quarter | Revenue ('000) | Profit before Tax ('000) | Profit ('000) | Profit Attb. to SH ('000) | EPS (Cent) | DPS (Cent) | NAPS | |
|---|---|---|---|---|---|---|---|---|---|
| 2014-12-31 | 2014-12-31 | 124,302 | -7,433 | -6,633 | -6,628 | -4.48 | - | 1.3700 | |
| 2014-12-31 | 2014-09-30 | 111,152 | 2,294 | 1,593 | 1,602 | 1.08 | - | 1.4100 | |
| 2014-12-31 | 2014-06-30 | 124,983 | 3,426 | 2,415 | 2,423 | 1.64 | - | 1.4000 | |
| 2014-12-31 | 2014-03-31 | 104,216 | 2,018 | 1,734 | 1,731 | 1.17 | - | 1.3900 | |
| 2013-12-31 | 2013-12-31 | 123,466 | 2,820 | 2,820 | 2,580 | 1.75 | - | - | |
| 2013-12-31 | 2013-09-30 | 121,342 | 2,568 | 1,372 | 1,365 | 0.92 | - | 1.3600 | |
| 2013-12-31 | 2013-06-30 | 118,933 | 4,168 | 3,314 | 3,309 | 2.24 | - | 1.3500 | |
| 2013-12-31 | 2013-03-31 | 128,909 | 5,516 | 4,398 | 4,384 | 2.97 | - | 1.3300 | |
| 2012-12-31 | 2012-12-31 | 127,484 | 2,127 | 1,382 | 1,614 | 1.09 | - | - | |
| 2012-12-31 | 2012-09-30 | 133,428 | 4,101 | 3,364 | 3,349 | 2.28 | - | 1.2600 | |
| 2012-12-31 | 2012-06-30 | 100,719 | 5,143 | 3,146 | 3,131 | 2.13 | - | 1.2400 | |
| 2012-12-31 | 2012-03-31 | 96,173 | 2,275 | 2,138 | 2,128 | 1.45 | - | 1.2200 | |
| 2011-12-31 | 2011-12-31 | 95,782 | 2,929 | 2,885 | 2,942 | 1.99 | - | - | |
| 2011-12-31 | 2011-09-30 | 89,986 | 2,709 | 2,744 | 2,778 | 1.86 | - | 1.1900 | |
| 2011-12-31 | 2011-06-30 | 92,321 | 4,639 | 3,400 | 3,382 | 2.30 | - | 1.1700 | |
| 2011-12-31 | 2011-03-31 | 101,338 | 6,708 | 5,265 | 5,283 | 3.56 | - | 1.1400 |
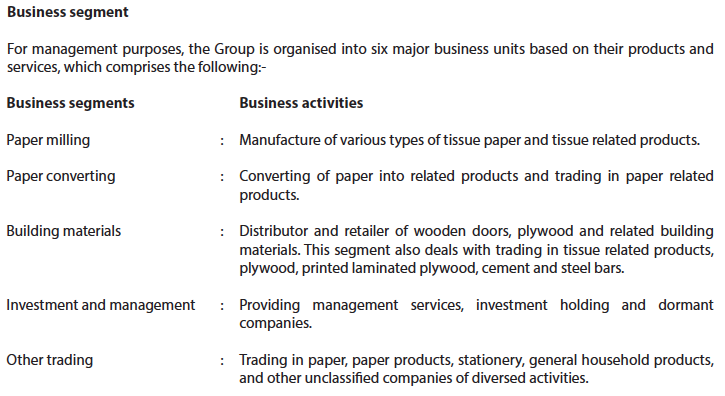
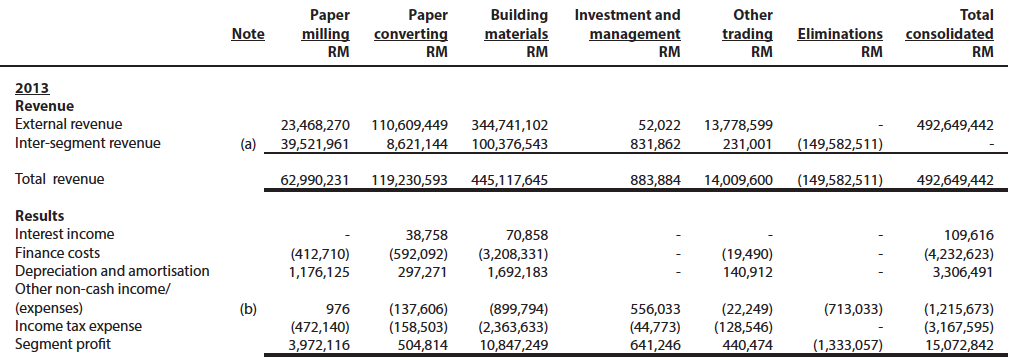
Segmental breakdown for FY2013 :-
Segmental breakdown for FY2014 :-
According to the company's annual report, almost all of the group's sales is derived from Malaysia. However, the company's website paints a picture of the group distributing its products all over the world.
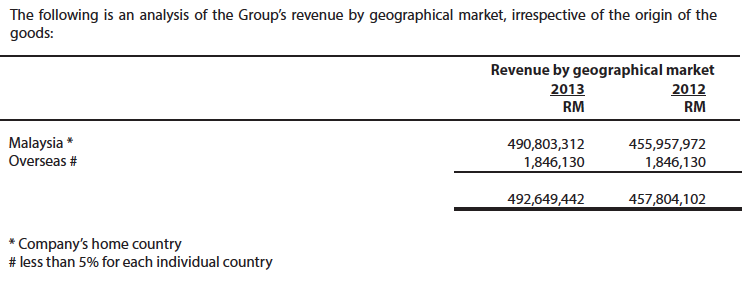
(Source : Annual Report 2013)
(Source : Company website)
No comments:
Post a Comment