High Growth, Cash Rich, Undervalued
Author: Icon8888 | Publish date: Fri, 27 Feb 2015, 04:30 PM
Hil Industries Berhad (HIL) Snapshot
Open
0.85
|
Previous Close
0.81
| |
Day High
0.89
|
Day Low
0.85
| |
52 Week High
02/9/15 - 0.90
|
52 Week Low
02/28/14 - 0.54
| |
Market Cap
242.0M
|
Average Volume 10 Days
54.0K
| |
EPS TTM
0.07
|
Shares Outstanding
276.6M
| |
EX-Date
07/23/14
|
P/E TM
12.3x
| |
Dividend
0.02
|
Dividend Yield
1.71%
|

HIL Industries Berhad manufactures and sells industrial and domestic molded plastic products in Malaysia and the People’s Republic of China. It operates through two principal segments: Manufacturing and Property Development.
The company offers various services, including design and development, mold and dies fabrication, injection molding, spray painting, etc.
It is also involved in the development of residential, commercial, and light industrial properties.
The company was founded in 1969 and is headquartered in Shah Alam, Malaysia.
HIL and A&M Realty has same major shareholder.
A&M's major shareholder :-

HIL's major shareholder :-

Quarter Result:
| F.Y. | Quarter | Revenue ('000) | Profit before Tax ('000) | Profit Attb. to SH ('000) | EPS (Cent) | NAPS |
|---|---|---|---|---|---|---|
| 2014-12-31 | 2014-12-31 | 42,498 | 10,188 | 7,737 | 2.80 | 1.0500 |
| 2014-12-31 | 2014-09-30 | 37,310 | 7,263 | 5,246 | 1.90 | 1.0200 |
| 2014-12-31 | 2014-06-30 | 32,345 | 5,575 | 4,138 | 1.50 | 1.0100 |
| 2014-12-31 | 2014-03-31 | 24,252 | 3,592 | 2,592 | 0.94 | 1.0000 |
| 2013-12-31 | 2013-12-31 | 23,697 | 2,898 | 2,111 | 0.76 | - |
| 2013-12-31 | 2013-09-30 | 21,122 | 1,654 | 739 | 0.27 | 0.9800 |
| 2013-12-31 | 2013-06-30 | 20,256 | 1,520 | 939 | 0.34 | 0.9800 |
| 2013-12-31 | 2013-03-31 | 16,575 | -554 | -1,002 | -0.36 | 0.9700 |
The group has strong balance sheets. It has net assets of RM292 mil, ZERO borrowings and cash of RM108.4 mil. Based on 277 mil shares, cash per share is RM0.39, repesenting 44% of existing price of RM0.88.


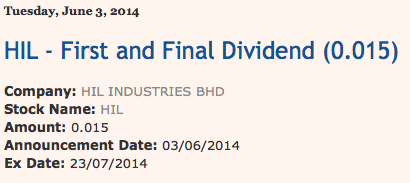
The company paid out 1.5 sen dividend in 2014. Based on 88 sen share price, dividend yield is 1.7%. Will the company pay out more now that profit has been growing nicely ?

Since early 2014, the group's earnings has been growing at leaps and bounce. Manufacturing and property development are the major contributors.
| (RM mil) | Mac 13 | Jun 13 | Sep 13 | Dec 13 | Mac 14 | Jun 14 | Sep 14 | Dec 14 | FY2013 | FY2014 |
| Revenue | 16.7 | 20.1 | 21.1 | 23.7 | 24.3 | 32.3 | 37.3 | 42.5 | 81.6 | 136.4 |
| > Manufacturing | 16.1 | 19.9 | 20.6 | 23.3 | 23.9 | 32.0 | 25.7 | 26.1 | 79.9 | 107.7 |
| > Prop development | 0.5 | 0.5 | 0.5 | 0.6 | 0.5 | 0.4 | 11.7 | 16.6 | 2.1 | 29.2 |
| PBT | (0.6) | 1.5 | 1.7 | 2.9 | 3.6 | 5.6 | 7.3 | 10.2 | 5.5 | 26.7 |
| > Manufacturing | (0.8) | 1.2 | 1.4 | 2.6 | 3.4 | 5.3 | 1.9 | 2.5 | 4.4 | 13.1 * |
| > Prop development | 0.3 | 0.3 | 0.2 | 0.4 | 0.2 | 0.3 | 5.4 ^ | 7.6 ^ | 1.2 | 13.5 * |
| Net profit | (1.1) | 0.9 | 0.7 | 2.1 | 2.6 | 4.1 | 5.2 | 7.7 | 2.6 | 19.6 |
| shares (mil) | 279 | 279 | 279 | 279 | 279 | 279 | 279 | 279 | 279 | 279 |
| EPS (sen) | (0.4) | 0.3 | 0.3 | 0.8 | 0.9 | 1.5 | 1.9 | 2.8 | 0.9 | 7.0 |
| PBT margin (%) | (3.6) | 7.5 | 7.8 | 12.2 | 14.8 | 17.3 | 19.5 | 24.0 | 6.7 | 19.5 |
| > Manufacturing | (5.0) | 6.0 | 6.8 | 11.2 | 14.2 | 16.6 | 7.4 | 9.6 | 5.5 | 12.2 |
| > Prop development | 60.0 | 60.0 | 40.0 | 72.7 | 40.0 | 75.0 | 46.2 # | 45.8 | 58.5 | 46.2 |
^ Since September 2014 quarter, property development has emerged as a major earnings contributor.
# Property development profit margin is high, probably due to low land cost.
* During FY2014, manufacturing and property development contributed equally to earnings. However, going forward, property development should play a more important role as the group books in further profit.
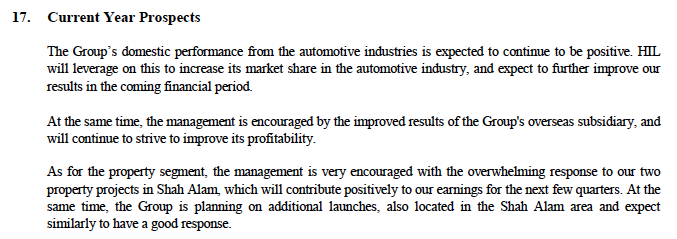
Despite property industry slowing down, the group remained saguine about the prospects of their development projects :-

The group's properties :-

Concluding Remarks
(a) The group has strong balance sheets with net cash of RM108.4 mil. Generous dividend payout in the future ?
(b) High property development profit margin propbably due to low land cost.
Despite making significant contribution to net profit, total revenue booked in over past 2 quarters are only RM29 mil.
With such high PBT margin, impact on future earnings can still be material.
For illustration purpose : based on assumption that total GDV is RM100 mil, remaining unbooked sales would be RM100 mil less RM29 mil = RM71 mil. Based on PBT margin of 46.2%, remaining PBT to be booked in is RM32.8 mil ? Net profit = RM24.6 mil ?
If that is the case, earnings over next one to two years looked pretty secured ? For further information, please refer to article below publlshed by The Edge Financial Daily in November 2014 :-


No comments:
Post a Comment