Author: Icon8888 | Publish date: Sat, 5 Dec 2015, 03:00 PM


1. Principal Business Activities
Samchem is principally involved in the following :-
(a) distribution of Polyurethane Chemicals;
(b) distribution of Intermediate Chemicals;
(c) distribution of Specialty Chemicals; and
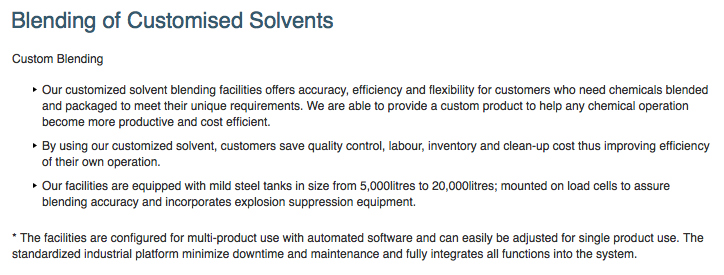
(d) blending of Customised Solvents.
Samchem is headquartered in Shah Alam, Selangor. It also has offices / warehouses in Perak and Johor.
Please refer to Appendix below for further details of the Group's products.

All of Samchem's Malaysian subsidiaries are 100% owned.
The company owns 96.5% of Indonesia subsidiary and has 56% effective interest in Vietnam subsidiaries.
According to FY2014 Annual Report, the Group's operation in Vietnam grew by an impressive 58.1%.

The Vietnam division continued its strong growth during the 9 months ended September 2015 and is the second largest contributor to revenue and operating profit.
2. Balance Sheets
The group has net assets of RM116 mil, cash of RM42 mil and loans of RM117mil. Net gearing is 0.65 times.
Bank borrowings comprise the followings :-

As shown above, RM97.3 mil of the loans are Bankers Acceptances and Trade Loans.
These trade facilities are used to finance inventories and huge receivables, very typical of a trading company.

3. Historical Profitability
Samchem has been consistently profitable since listing in 2009.
Annual Result:
| F.Y. | Revenue ('000) | Profit Attb. to SH ('000) | EPS (Cent) | DPS (Cent) | DY |
|---|---|---|---|---|---|
| TTM | 605,890 | 7,232 | 5.32 | 0.04 | 0.05 |
| 2014-12-31 | 632,350 | 6,254 | 4.60 | 0.02 | 0.03 |
| 2013-12-31 | 543,021 | 8,740 | 6.43 | 0.02 | 0.03 |
| 2012-12-31 | 526,448 | 8,702 | 6.40 | - | - |
| 2011-12-31 | 507,395 | 17,778 | 13.07 | - | - |
| 2010-12-31 | 470,545 | 16,099 | 11.84 | - | - |
| 2009-12-31 | 294,039 | 12,399 | 9.92 | 2.80 | 3.46 |

Key observations :-
(a) There is a huge drop in interest expenses from RM9 mil in FY2014 to RM4.53 mil in FY2015 (estimate). This is definitely a postitive development. Hopefully it is sustainable .
Based on total borrowings of RM117 mil, effective interest rate is 3.9%.
This is a huge improvement. In FY2014, the group incurred interest expenses of RM9 mil against borrowings of RM156 mil, which translates into effective interest rate of 5.8%.
(b) Devaluation of Ringgit seemed to be positive to profit margin, with its PBT margin expanding from 2.2% in FY2013 and FY2014 to 4.5% in FY2015.
(c) As at 30 September 2015, RM66.6 mil of the loans are denominated in USD (down from RM92.2 mil as at 31 December 2014).
Based on back of envelope calculation, a 24% devaluation of Ringgit (from 3.4 to 4.2) should have resulted in RM16 mil forex losses. However, so far the group has only booked in forex losses of RM8.9 mil.
Either they have put in place proper hedging or there are more to come. We will have to wait to find out.
(d) The Group is doing well in Vietnam, benefiting from the country's manufacturing boom. Vietnam division has become the second largest profit contributor. However, since the group only owns 56% effective interest, impact on net profit has been less pronounced (earnings leakage).
4. Concluding Remarks
Based on 136 mil shares and RM0.79, the company has market cap of RM107 mil. Based on annualised profit of RM10.4 mil, prospective PER is approximately 10 times.
Operationally, the group is doing well, especially the Vietnam division.
However, borrowings is a bit high. This is typical of a trading company. I don't think there is anything that the company can do about it. I wouldn't want to be too harsh on them for that.
Weak Ringgit seemed to be positive for their profit margin. However, the group has huge USD denominated loans, which offsets whatever benefits arising from the strong USD. At this stage, it is not clear that they have fully provided for the potential forex losses. This creates an overhang.
No good reason to rush in.
Appendix - Chemicals Distributed By The Samchem Group


No comments:
Post a Comment