Author: Icon8888 | Publish date: Tue, 7 Jul 2015, 01:57 PM
(Mari mari, 61 sen satu biji)
1. Introduction
I first wrote about Media Chinese International Ltd ("MCIL") in January 2015.
http://klse.i3investor.com/blogs/icon8888/68713.jsp
The company's shares were trading at approximately 68 sen then.
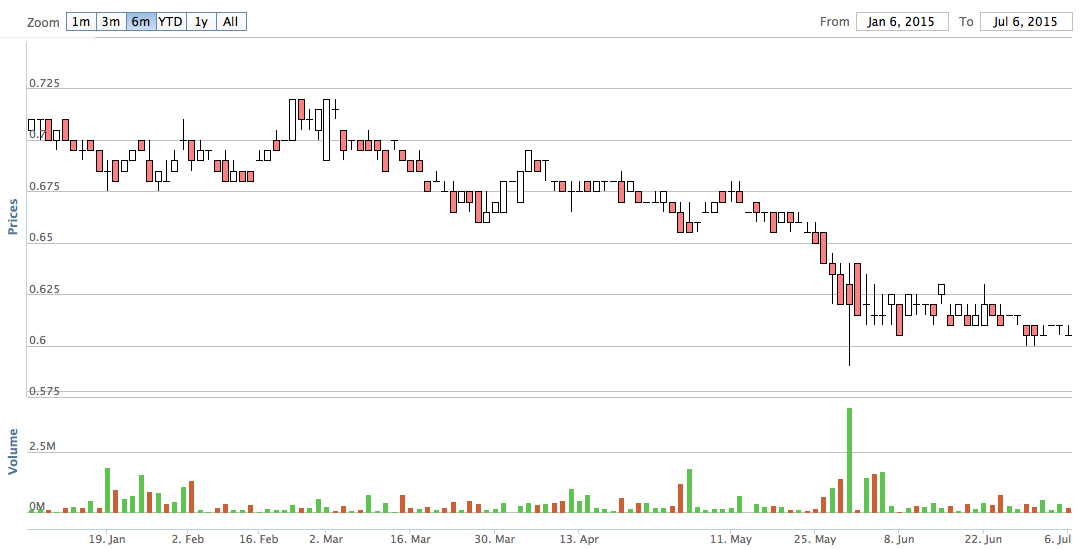
On 28 May 2015, the company announced its financial results for the quarter ended 31 March 2015. The results was a shock to many investors. Net profit declined by a whopping 75% from RM37.1 mil to RM9.3 mil.
As a result, share price took a beating. As at the date of this article, the company's shares are trading at 60.5 sen.
Having bought my first batch in January 2015 at 68 sen, I took the opportunity to buy more at 61 sen.
The latest quarter's poor result was actually caused by exceptional item in the form of goodwill impairment amounting to RM28 mil.
Added back the RM28 mil, net profit would have been RM37.4 mil. This would be more or less the same as December 2014 quarter.
How has the group actually performed in this latest quarter ?
2. The Blind Men and The Elephant

There is something very unique about MCIL. While the bulk of its earnings is derived from Malaysia, it is listed on both Malaysia and Hong Kong.
In normal days, financial information is of course compiled based on the currency of the country of operations. For example : when Sin Chew pays salary to its employees, it books it in Ringgit terms instead of US Dollar.
These data will then be put together at the end of the reporting period and presented in US Dollar terms for HKSE reporting purpose.
The same set of data, when presented in US Dollars, will be different from that presented in Ringgit.
For example : let's say the Malaysia operation reported net profit of RM10 mil, exactly the same as previous quarter. However, as the Ringgit has declined from RM3.30 to RM3.80 per US Dollar, for Hong Kong based investors, earnings has dropped by 13% from USD3.03 mil to USD2.63 mil.
The writer for the commentaries in the financial report seemed to look at things from US Dollar angle. This is different from looking at things through Ringgit point of view.
For comparison purpose, I decide to present two sets of analysis, one based on US Dollars while the other in Ringgit.
3. Analysis of Latest Quarter Based on US Dollars
The following table sets out MCIL's historical financial performance from September 2013 until March 2015. The figures are in US Dollars. The company's HKSE reporting seemed to look at things from this point of view.
| Quarterly (in USD mil) | Sep13 | Dec13 | Mar14 | Jun14 | Sep14 | Dec14 | Mar15 |
| USD : RM | 3.26 | 3.28 | 3.27 | 3.21 | 3.28 | 3.50 | 3.70 |
| Revenue | 125.5 | 117.3 | 99.6 | 115.5 | 121.7 | 105.2 | 86.8 |
| > Msia & SEA | 69.0 | 71.4 | 65.9 | 66.7 | 65.5 | 62.0 | 55.8 |
| > HK & China | 16.7 | 21.9 | 15.5 | 17.0 | 17.7 | 20.4 | 14.6 |
| > North America | 6.2 | 6.8 | 6.5 | 6.0 | 5.9 | 6.2 | 5.5 |
| > Travel and others | 33.6 | 17.2 | 11.8 | 25.8 | 32.6 | 16.6 | 10.9 |
| revenue change (%) | n/a | (6.5) | (15.1) | 15.9 | 5.4 | (13.5) | (17.5) |
| Gross profit | 45.0 | 49.3 | 40.7 | 41.4 | 42.0 | 43.6 | 38.5 |
| Gross margin (%) | 35.8 | 42.0 | 40.9 | 35.9 | 34.5 | 41.5 | 44.3 |
| admin+distbn exp | (29.2) | (30.8) | (30.0) | (30.0) | (29.1) | (29.8) | (26.0) |
| admin+distbn/revenue (%) | 23.3 | 26.3 | 30.1 | 26.0 | 23.9 | 28.3 | 29.9 |
| PBT b4 EI | 19.4 | 22.3 | 15.1 | 14.2 | 15.8 | 17.4 | 15.3 |
| > Msia & SEA | 16.0 | 17.3 | 15.2 | 12.0 | 12.7 | 12.6 | 16.4 |
| > HK & China | 0.8 | 4.6 | 0.0 | 0.9 | 1.2 | 3.6 | (0.7) |
| > North America | (0.2) | 0.4 | 0.5 | 0.0 | (0.3) | 0.4 | 0.1 |
| > Travel and others | 2.8 | 0.0 | (0.5) | 1.3 | 2.2 | 0.8 | (0.5) |
| PBT b4 EI margin (%) | 15.4 | 19.0 | 15.1 | 12.3 | 13.0 | 16.5 | 17.6 |
| > Msia & SEA | 23.2 | 24.2 | 23.0 | 18.0 | 19.3 | 20.3 | 29.4 |
| > HK & China | 4.7 | 20.9 | 0.0 | 5.5 | 6.5 | 17.6 | (5.0) |
| > North America | (3.6) | 5.7 | 6.9 | 0.0 | (4.3) | 6.0 | 2.1 |
| > Travel and others | 8.3 | 0.0 | (4.6) | 4.9 | 6.7 | 4.8 | (4.5) |
| Impairment | 0.0 | 0.0 | 0.0 | 0.0 | 0.0 | 0.0 | (5.7) |
| > Msia & SEA | 0.0 | 0.0 | 0.0 | 0.0 | 0.0 | 0.0 | (5.3) |
| > HK & China | 0.0 | 0.0 | 0.0 | 0.0 | 0.0 | 0.0 | (0.4) |
| > North America | 0.0 | 0.0 | 0.0 | 0.0 | 0.0 | 0.0 | 0.0 |
| > Travel and others | 0.0 | 0.0 | 0.0 | 0.0 | 0.0 | 0.0 | 0.0 |
| PBT after EI | 19.4 | 22.3 | 15.1 | 14.2 | 15.8 | 17.4 | 9.6 |
| > Msia & SEA | 16.0 | 17.3 | 15.2 | 12.0 | 12.7 | 12.6 | 11.1 |
| > HK & China | 0.8 | 4.6 | 0.0 | 0.9 | 1.2 | 3.6 | (1.1) |
| > North America | (0.2) | 0.4 | 0.5 | 0.0 | (0.3) | 0.4 | 0.1 |
| > Travel and others | 2.8 | 0.0 | (0.5) | 1.3 | 2.2 | 0.8 | (0.5) |
| Int exp | (2.1) | (2.0) | (1.6) | (1.6) | (1.7) | (1.6) | (1.4) |
| other expenses | (0.4) | (0.3) | (0.3) | (0.1) | (0.2) | (0.4) | (0.5) |
| associates | (0.1) | (0.0) | (0.1) | (0.0) | (0.0) | 0.0 | 0.0 |
| assoc impairment | 0.0 | 0.0 | 0.0 | 0.0 | 0.0 | 0.0 | (1.9) |
| PBT | 16.8 | 19.9 | 13.0 | 12.5 | 13.9 | 15.4 | 5.8 |
| tax | (4.6) | (5.4) | (4.1) | (4.1) | (3.7) | (4.3) | (4.3) |
| tax rate (%) | 27.3 | 26.8 | 31.3 | 32.5 | 27.0 | 28.2 | 73.1 |
| PAT | 12.2 | 14.6 | 8.9 | 8.4 | 10.1 | 11.0 | 1.6 |
| MI | (0.1) | (0.7) | 0.0 | (0.2) | 0.0 | (0.5) | 1.0 |
| Net profit | 12.1 | 13.9 | 8.9 | 8.3 | 10.1 | 10.6 | 2.5 |
| Net profit w/o EI | 12.1 | 13.9 | 8.9 | 8.3 | 10.1 | 10.6 | 10.1 |
Key Observations (US Dollar based)
(a) Decline in Revenue
Compared to December 2014 quarter, this quarter's revenue declined by 17.5% from USD105.2 mil to USD86.8 mil.
Malaysian operation suffered a decline of 10% mostly due to weak sentiment caused by implementation of GST.
Greater China revenue declined by 29% due to lower advertisement as sale of luxury goods declined.
North America's revenue was more or less flat.
Travel division's revenue declined by 34%. No explanation was given.
It seemed that the huge decline in group revenue was mostly due to non Malaysian operations.
(b) Expansion of Gross Margin
One thing that stood out prominently was the unusually high gross margin for Malaysian operation of 29.4% (compared to 20.3% in December 2014 quarter). It was the savior for the group.
It is not clear what caused the spike in gross margin. As we all know, Gross Profit = Revenue - Cost of Goods Sold. With revenue in decline, margin expansion must be due to lower cost of goods sold.
One possibility is lower newsprint cost (which was mentioned in the quarterly report). Unfortunately, I am not able to dig out historical price trend of newsprint price from public sources for confirmation.
In the coming quarter, can the high gross margin be repeated ?
(c) Significant Decline in Admin + Distribution Expenses ?
In USD terms, admin + distribution expenses experinced a sharp drop from USD29.8 mil to USD26 mil, a decline of USD3.8 mil !!! This is very significant as net profit (without exceptional items) was only USD10.1 mil.
My first impression was that the group must have undertaken cost cutting measures to significantly improve its efficiency.
However, after taking a closer look, I am of the opinion that the decline was principally due to weakening of Ringgit. This is because those expenses as a percentage of revenue has not dropped (instead it has gone up, 29% vs 28.3% in previous quarter).
This was further confirmed by Ringgit figures (as shown in section below) which remained more or less the same y-o-y (RM96.2 mil vs RM98.1 mil in March 2014 quarter).
(note : q-o-q comparison might not be valid as December quarter operating expenses are traditionally highest, probably due to payment of year end bonus to employees)
(d) Impairment of Goodwill
The group made provision for impairment of goodwill of USD5.3 mil, USD0.4 mil and USD1.9 mil for its operation at Malaysia, Greatr China and associate level respectively.
Total amount was USD7.6 mil (RM28 mil).
4. Analysis of Latest Quarter Based on Ringgit
| Quarterly (in RM mil) | Sep13 | Dec13 | Mar14 | Jun14 | Sep14 | Dec14 | Mar15 |
| USD : RM | 3.26 | 3.28 | 3.27 | 3.21 | 3.28 | 3.50 | 3.70 |
| Revenue | 409.1 | 384.8 | 325.7 | 370.7 | 399.1 | 368.2 | 321.2 |
| > Msia & SEA | 224.9 | 234.2 | 215.4 | 214.1 | 214.8 | 216.9 | 206.5 |
| > HK & China | 54.3 | 71.8 | 50.7 | 54.6 | 58.1 | 71.4 | 54.2 |
| > North America | 20.2 | 22.4 | 21.2 | 19.3 | 19.2 | 21.7 | 20.4 |
| > Travel and others | 109.5 | 56.5 | 38.6 | 82.8 | 107.0 | 58.1 | 40.3 |
| revenue change (%) | n/a | (5.9) | (15.4) | 13.8 | 7.7 | (7.7) | (12.8) |
| Gross profit | 146.7 | 161.3 | 133.1 | 132.9 | 137.7 | 152.7 | 142.5 |
| Gross margin (%) | 35.8 | 41.9 | 40.9 | 35.9 | 34.5 | 41.5 | 44.3 |
| admin+distbn exp | (95.3) | (101.0) | (98.1) | (96.3) | (95.3) | (104.3) | (96.2) |
| admin+distbn/revenue (%) | 23.3 | 26.2 | 30.1 | 26.0 | 23.9 | 28.3 | 29.9 |
| PBT b4 EI | 63.1 | 73.0 | 49.2 | 45.6 | 51.7 | 60.8 | 56.6 |
| > Msia & SEA | 52.1 | 56.7 | 49.5 | 38.5 | 41.6 | 44.1 | 60.7 |
| > HK & China | 2.6 | 15.0 | 0.0 | 3.0 | 3.8 | 12.6 | (2.7) |
| > North America | (0.7) | 1.3 | 1.5 | 0.0 | (0.8) | 1.3 | 0.4 |
| > Travel and others | 9.1 | 0.0 | (1.8) | 4.1 | 7.2 | 2.8 | (1.8) |
| PBT b4 EI margin (%) | 15.4 | 19.0 | 15.1 | 12.3 | 13.0 | 16.5 | 17.6 |
| > Msia & SEA | 23.2 | 24.2 | 23.0 | 18.0 | 19.3 | 20.3 | 29.4 |
| > HK & China | 4.7 | 20.9 | 0.0 | 5.5 | 6.5 | 17.6 | (5.0) |
| > North America | (3.6) | 5.7 | 6.9 | 0.0 | (4.3) | 6.0 | 2.1 |
| > Travel and others | 8.3 | 0.0 | (4.6) | 4.9 | 6.7 | 4.8 | (4.5) |
| Impairment | 0.0 | 0.0 | 0.0 | 0.0 | 0.0 | 0.0 | (21.0) |
| > Msia & SEA | 0.0 | 0.0 | 0.0 | 0.0 | 0.0 | 0.0 | (19.7) |
| > HK & China | 0.0 | 0.0 | 0.0 | 0.0 | 0.0 | 0.0 | (1.3) |
| > North America | 0.0 | 0.0 | 0.0 | 0.0 | 0.0 | 0.0 | 0.0 |
| > Travel and others | 0.0 | 0.0 | 0.0 | 0.0 | 0.0 | 0.0 | 0.0 |
| PBT after EI | 63.1 | 73.0 | 49.2 | 45.6 | 51.7 | 60.8 | 35.6 |
| > Msia & SEA | 52.1 | 56.7 | 49.5 | 38.5 | 41.6 | 44.1 | 41.0 |
| > HK & China | 2.6 | 15.0 | 0.0 | 3.0 | 3.8 | 12.6 | (4.0) |
| > North America | (0.7) | 1.3 | 1.5 | 0.0 | (0.8) | 1.3 | 0.4 |
| > Travel and others | 9.1 | 0.0 | (1.8) | 4.1 | 7.2 | 2.8 | (1.8) |
| Int exp | (7.0) | (6.6) | (5.3) | (5.2) | (5.5) | (5.5) | (5.3) |
| other expenses | (1.1) | (1.0) | (1.0) | (0.3) | (0.7) | (1.4) | (1.7) |
| associates | (0.3) | (0.0) | (0.4) | (0.0) | (0.0) | 0.0 | 0.0 |
| assoc impairment | 0.0 | 0.0 | 0.0 | 0.0 | 0.0 | 0.0 | (7.0) |
| PBT | 54.7 | 65.4 | 42.5 | 40.0 | 45.5 | 53.9 | 21.6 |
| tax | (14.9) | (17.5) | (13.3) | (13.0) | (12.3) | (15.2) | (15.8) |
| tax rate (%) | 27.3 | 26.8 | 31.3 | 32.5 | 27.0 | 28.2 | 73.1 |
| PAT | 39.8 | 47.8 | 29.2 | 27.0 | 33.2 | 38.7 | 5.8 |
| MI | (0.4) | (2.2) | 0.0 | (0.5) | 0.0 | (1.6) | 3.6 |
| Net profit | 39.3 | 45.6 | 29.2 | 26.5 | 33.2 | 37.0 | 9.4 |
| Net profit w/o EI | 39.3 | 45.6 | 29.2 | 26.5 | 33.2 | 37.0 | 37.4 |
Key Observations (RM based)
(a) Decline in Revenue
Compared to December 2014 quarter, this quarter's revenue declined by 12.8% from RM368.2 mil to RM321.2 mil. Surpisingly, the Malaysia operation held on quite well (decline of 5% only). The majority of the decline was caused by its Greater China and travel divisions.
This is actually quite significant. Over the past 6 months, analysts were all gloomy about the near term outlook of the domestic media industry. Everybody was talking about the negative impact of GST, the drag of softening oil price on the economy, the fragile sentiment caused by political uncertainties, structural decline of Chinese language newspaper circulation, etc.
However, the latest quarter's figures seemed to tell a different story. Malaysia newspaper operation seemed to be doing fine.
I will keep my mind open and wait for next quarter results before jumping into conclusion.
(b) Expansion of Gross Margin
Same as US Dollar analysis above.
(c) Admin + Distribution Expenses Remained The Same
Compared to March 2014 quarter, these expenses declined by RM2 mil only (2%). This amount of saving is too small to have a material impact on overall profitability. As a percentage of revenue, these expenses remained high at 29.9%.
As a conclusion, they did not play a major positive role for this quarter's result.
(d) Impairment of Goodwill
Same as US Dollar analysis above.
Total amount was RM28 mil.
5. Performance Over Past Few Quarters
In section 3 and 4 above, I discussed the group's latest quarter performance.
However, that is not sufficient for us to fully understand the group. We need to look back few more quarters in order to feel its past glory, the problems it faced and its future potential.
Quarter Result:
| F.Y. | Quarter | Revenue ('000) | Profit Attb. to SH ('000) | EPS (Cent) | DPS (Cent) |
|---|---|---|---|---|---|
| 2015-03-31 | 2015-03-31 | 321,497 | 9,225 | 0.56 | 1.83 |
| 2015-03-31 | 2014-12-31 | 367,814 | 37,112 | 2.20 | - |
| 2015-03-31 | 2014-09-30 | 399,142 | 32,920 | 1.94 | 1.44 |
| 2015-03-31 | 2014-06-30 | 370,758 | 26,616 | 1.57 | - |
| 2014-03-31 | 2014-03-31 | 368,902 | 33,109 | 1.96 | 2.52 |
| 2014-03-31 | 2013-12-31 | 384,321 | 45,539 | 2.69 | - |
| 2014-03-31 | 2013-09-30 | 409,018 | 39,333 | 2.35 | 2.42 |
| 2014-03-31 | 2013-06-30 | 399,177 | 42,117 | 2.50 | - |
| 2013-03-31 | 2013-03-31 | 359,509 | 44,280 | 2.61 | 3.31 |
| 2013-03-31 | 2012-12-31 | 376,312 | 45,561 | 2.69 | - |
| 2013-03-31 | 2012-09-30 | 371,758 | 39,889 | 2.36 | 2.05 |
| 2013-03-31 | 2012-06-30 | 391,355 | 48,716 | 2.89 | - |
As shown in table above, March 2014 was the watershed quarter. Before that, the group reported average net profit of RM42.8 mil per quarter. However, from March 2014 onwards, average net profit made a quantum drop to RM32.4 mil per quarter, a decline of 25%.
As a result, share price started on a downward trend from more than 90 sen in early 2014 to the current 60.5 sen, a decline of 50% over 1.5 years.

What has actually happened ?
First of all, there was a series of unfortunate events.

According to the company :-
** In March 2014 quarter, sales was affected by (i) MH370 incident (8 March 2014). Events and promotions were held back or cancelled, reducing demand for advertisement, and (ii) subsidy rationalisation plans by government, which dampened sentiment.
** In June 2014 quarter, sales was affected by (i) announcement of GST which dampened sentiment, (ii) MH370 incident continued to affect April and May advertisement sales as events and promotions were held back or cancelled, and (iii) subsidy rationalisation plans by government.
** In September 2014 quarter, (i) MH17 affected advertisement revenue in July and August, and (ii) toning down of National Day celebration also affected sales.
** In December 2014 quarter, affected by (i) cautious spending ahead of GST, and (ii) one of the worst flood in history.
** In March 2015 quarter, affected by (i) implementaion of GST which dampened sentiment, (ii) lower oil price resulted in economic uncertainties, which affected sentiment, and (iii) recent political uncertainties.
6. Structural Decline ?
Apart from a series of bad results, investors sentiment is also dampened by the following concerns :-
(a) Chinese language newspapers experiencing decline in readerships ? and
(b) threats from internet based media such as Facebook (and our own forum i3 ? which recently saw increase in number of advertisement ?)
I don't have answers for the above issues. However, I don't believe that print media is heading towards terminal decline.
All those challenges might take a slice off the original pie, but Malaysia is still a devloping country and there are plenty of room for growth.
Even though the relative share might be smaller, I think the absolute amount could still be rising for everybody, including print media.
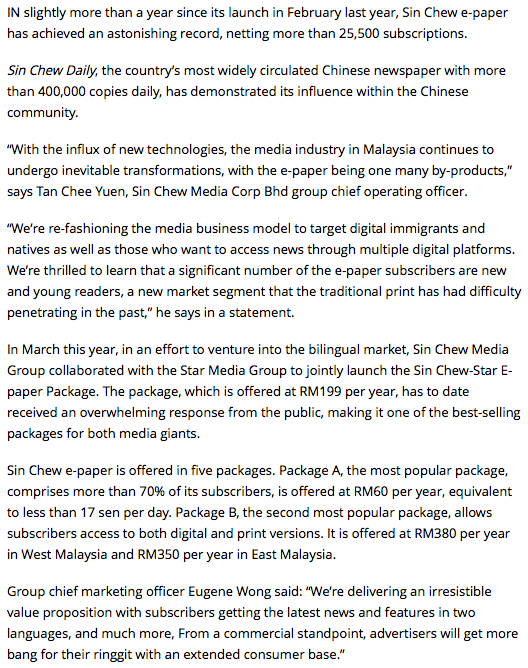
I believe there are still many things that can be done to dilute the abovementioned threats. For example, Sin Chew and Star has teamed up recently to sell their papers in digital format and has been met with very encouraging responses. Please refer to article below.
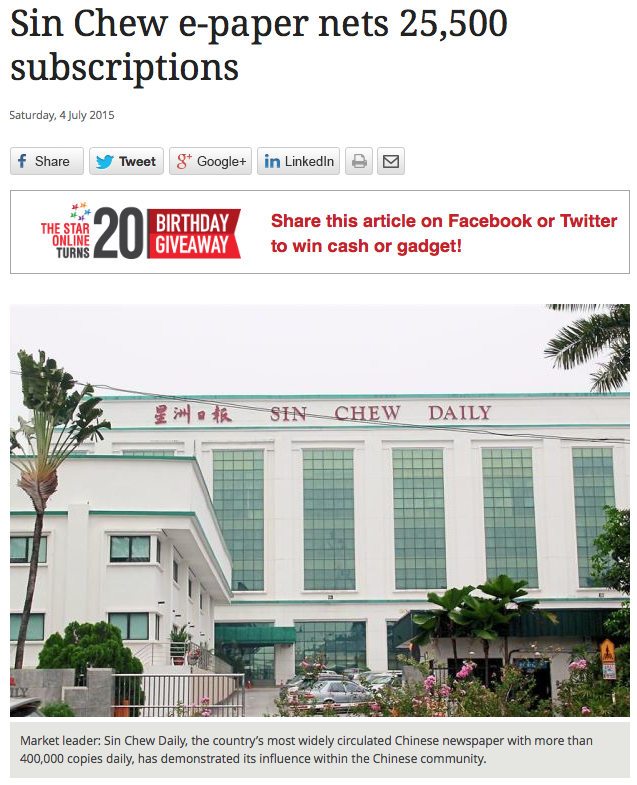
(source : The Star 4 July 2015)
The main reason the products are well received is of course because of the lower cost. But wouldn't that have an impact on profitability or cannibalise its existing market share ?
Not really, the bulk of print media revenue is from advertisement. Expansion of readership is conducive for getting good rates for advertising space.
Furthermore, lower selling price of the e paper is matched by lower production cost as they is no use of newsprint and other materials. The cost savings should be quite material.
Another strategy is cost cutting. In final quarter of 2014, Media Prima undertook Mutual Seperation Scheme to trim its workforce for a cost of RM78.9 mil. Based on 4,600 employees, payment per head is approximately RM17,000. According to Media Prima, the payback period is only 2 years. In my opinion, this is a Sure Win strategy - it is better than any investment, you wll get RM39 mil per annum by just shaking legs.
The same strategy can be applied to MCIL. If there is indeed a decline in readership for Chinese language newspapers, downsizing of workforce and other cost cutting measures should be able to return the group to sound financial footing again.

(Good time will be back for patient shareholders...)
7. Analysts' Recommendations
HLIB has a Hold call. Its Target Price for MCIL is 62 sen. It expects the group to report EPS of 7.2 sen in the current financial year. Dividend yield is ecpected to be 4.7%.
A "Hold" for MCIL at 62 sen ? MCIL only deserves PER of 8.6 times ?
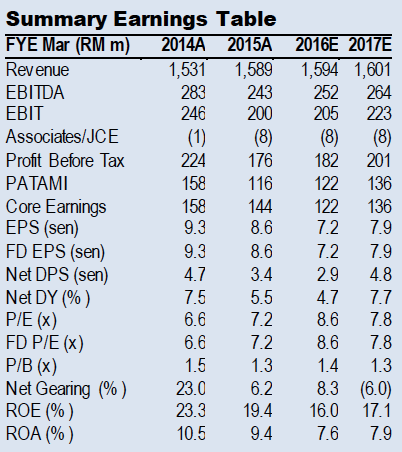
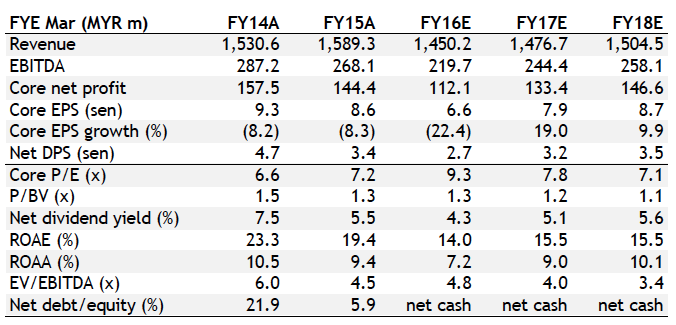
Maybank IB also has a Hold call. Its Target Price for MCIL is 65 sen. It expects EPS of 6.6 sen for current financial year. Dividend yield is expected to be 4.3%.
At least in this case, it makes some sense as the PER is 9.3 times.
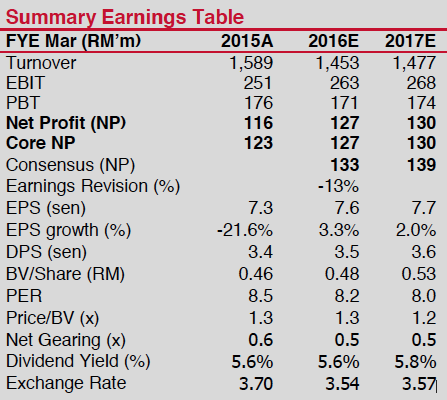
Kenanga also has a Hold call. Its Target Price for MCIL is 57 sen. Based on FY2016 expected EPS of 7.6 sen, MCIL only deserves PER of 7.5 times ?
8. Concluding Remarks
(a) Studying the MCIL group, one thing that left me the deepest impression is how much the advertising industry is influenced by sentiment.
In a certain sense, it is very similar to the stock market. Share price goes up and down driven by emotions.
It seemed that propensity to advertise is also very much driven by emotion. When the economy is doing well, advertisers will loosen their purse strings. However, when certain events (for example, MH370) occurred that dampened sentiment, even though the real economy is intact, advertisers will pull back.
(b) By virtue of their sensitivity to macro environment, I feel that media companies should be treated as high beta stocks. Sentiment might be a bit subdued now. However, one day, our economy will boom again, and these stocks will fly. Driven not only by better sentiment, but actual improvement in earnings in a big way, as advertisers go all out to capture market share.
(c) In other words, don't write these counters off. One day, they will be back with a vengeance.
Have a nice day.
No comments:
Post a Comment