Manufacturer of Formaldehyde Based Adhesive and Resins
Author: Icon8888 | Publish date: Sun, 15 Feb 2015, 08:37 PM
Hexza Corp Bhd (HEX) Snapshot
Open
0.80
|
Previous Close
0.80
| |
Day High
0.82
|
Day Low
0.80
| |
52 Week High
08/19/14 - 0.88
|
52 Week Low
12/17/14 - 0.63
| |
Market Cap
163.3M
|
Average Volume 10 Days
242.0K
| |
EPS TTM
0.06
|
Shares Outstanding
200.4M
| |
EX-Date
11/24/14
|
P/E TM
12.7x
| |
Dividend
0.04
|
Dividend Yield
4.94%
|
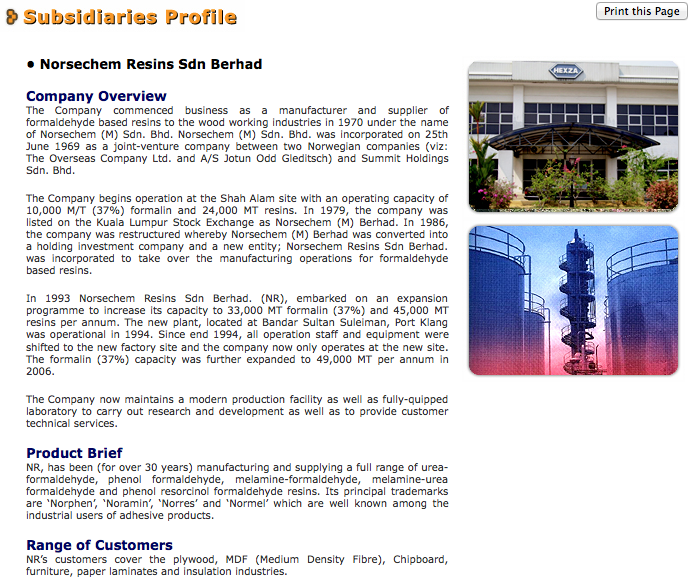
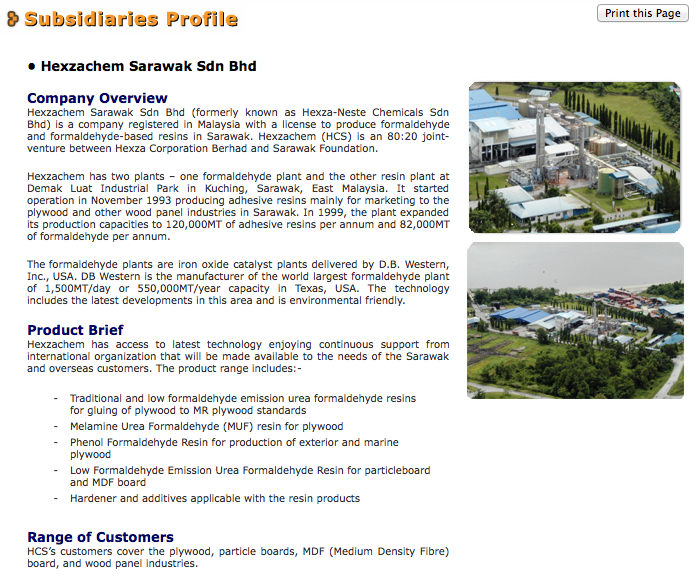
Hexza Corporation Berhad is engaged in the manufacture and sale of formaldehyde, and formaldehyde based adhesive and resins for timber related industries primarily in Malaysia under the Norphen, Noramin, Norres, and Normel names.
The company also offers ethyl alcohol, liquefied carbon dioxide, and kaoliang wine to pharmaceutical companies, wine and beverage bottlers, and paint and consumable products manufacturers, as well as for industrial applications.
In addition, it manufactures natural fermented vinegar for various manufacturers that produce sauces, as well as flavoring and other food industries.
Further, Hexza Corporation Berhad is involved in marketing and distributing consumer products and industrial chemicals, as well as developing residential and commercial properties. The company was formerly known as Norsechem (M) Sdn. Bhd. and changed its name to Hexza Corporation Berhad in July 1986. Hexza Corporation Berhad was incorporated in 1969 and is based in Ipoh, Malaysia.
Quarter Result:
| F.Y. | Quarter | Revenue ('000) | Profit before Tax ('000) | Profit Attb. to SH ('000) | EPS (Cent) | DPS (Cent) | NAPS |
|---|---|---|---|---|---|---|---|
| 2015-06-30 | 2014-12-31 | 37,897 | 5,785 | 4,266 | 2.10 | - | 1.0600 |
| 2015-06-30 | 2014-09-30 | 39,261 | 6,173 | 4,157 | 2.10 | - | 1.1000 |
| 2014-06-30 | 2014-06-30 | 42,077 | 4,429 | 3,118 | 1.50 | 4.00 | 1.0800 |
| 2014-06-30 | 2014-03-31 | 35,539 | 1,717 | 1,332 | 0.70 | - | 1.0500 |
| 2014-06-30 | 2013-12-31 | 36,285 | 3,408 | 2,609 | 1.30 | - | 1.0500 |
| 2014-06-30 | 2013-09-30 | 31,440 | 1,193 | 1,020 | 0.50 | - | 1.0700 |
| 2013-06-30 | 2013-06-30 | 32,594 | 6,547 | 6,030 | 3.00 | 4.00 | - |
| 2013-06-30 | 2013-03-31 | 30,482 | 1,304 | 773 | 0.40 | - | 1.0400 |
| 2013-06-30 | 2012-12-31 | 30,146 | 1,823 | 1,000 | 0.50 | - | 1.0400 |
| 2013-06-30 | 2012-09-30 | 31,335 | 399 | 672 | 0.30 | - | 1.0700 |
| 2012-06-30 | 2012-06-30 | 37,396 | 2,225 | 1,491 | 0.70 | 4.00 | - |
| 2012-06-30 | 2012-03-31 | 37,196 | 2,046 | 1,025 | 0.50 | - | 1.0100 |
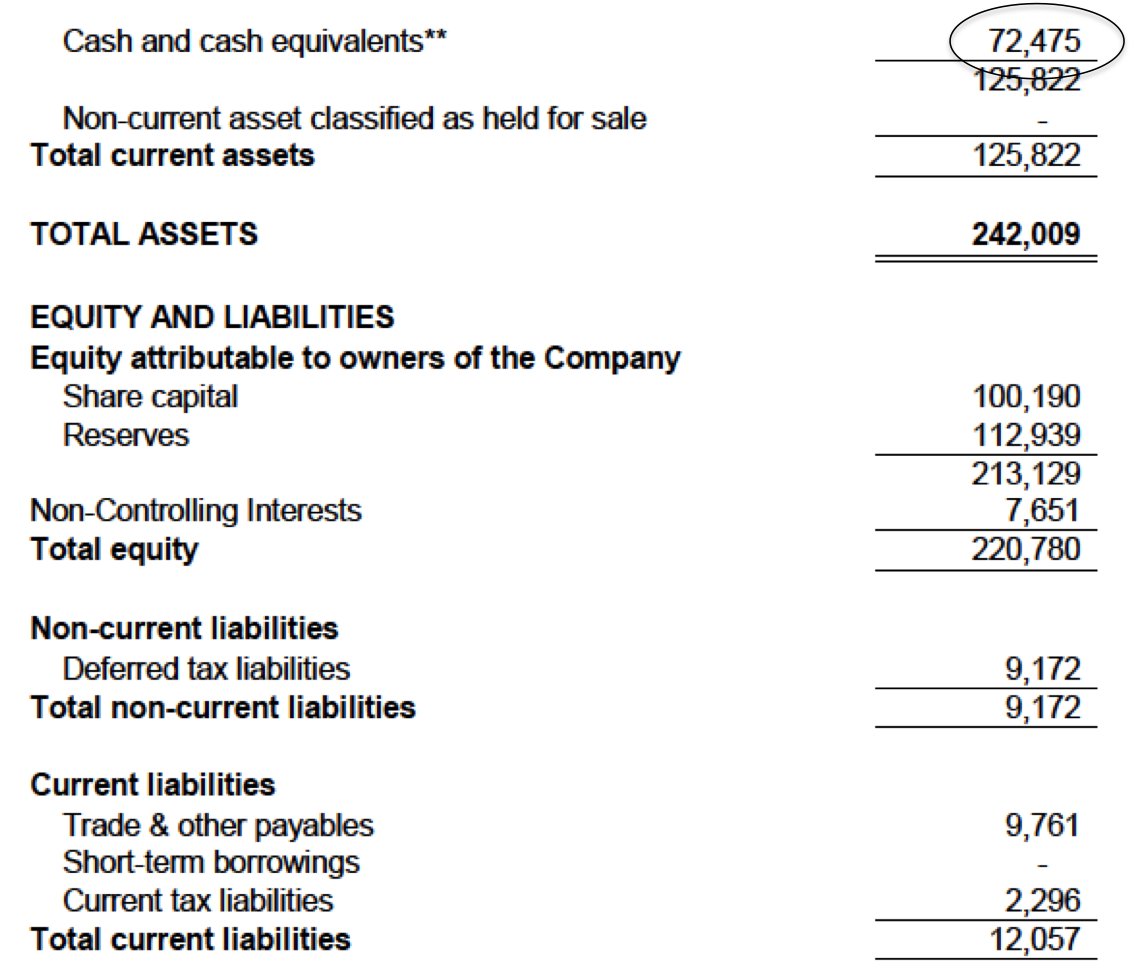
Strong balance sheets. The group has net cash of RM72.5 mil, equivalent to 36 sen per share (share price now 80 sen).
Manufactruing division is the major earnings contributor :-
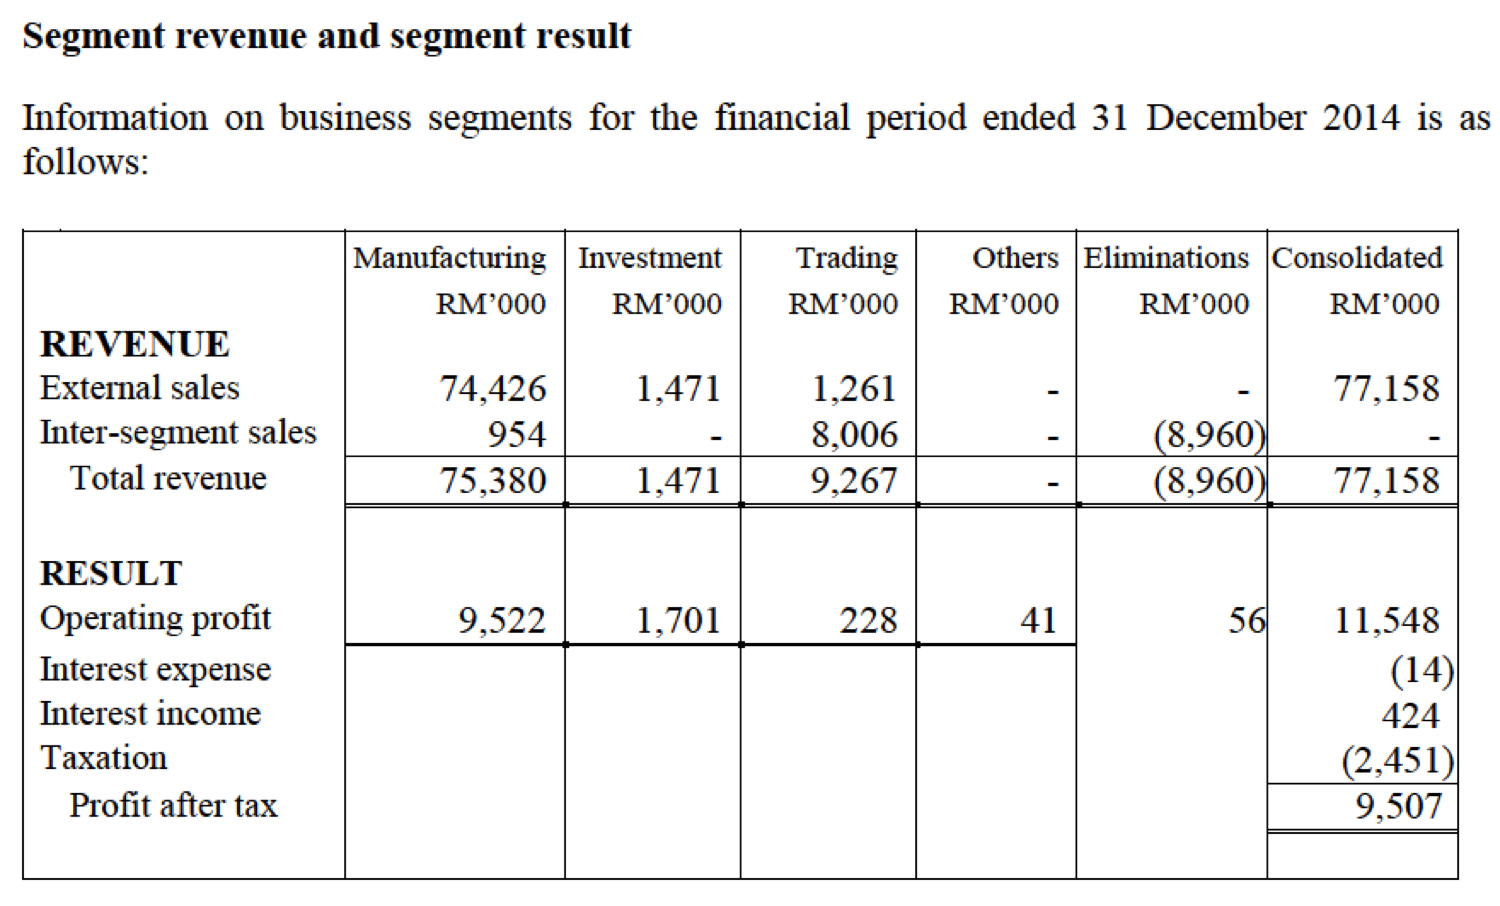
Despite lower revenue, lower raw material cost results in higher profitability :-
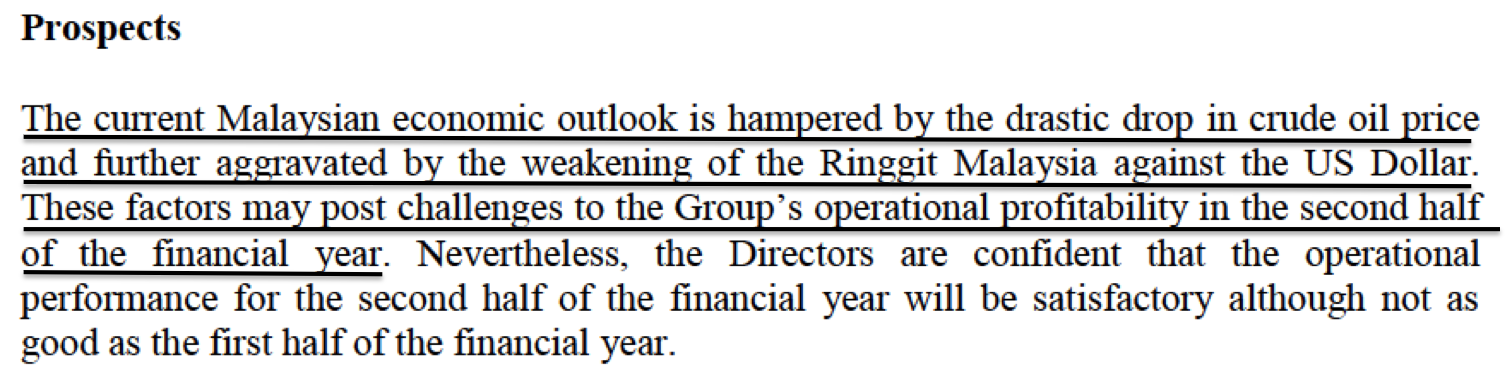
The group sells almost all its products in Malaysia. According to the management, the weak Ringgit might have adverse impact on the group's profitability :-
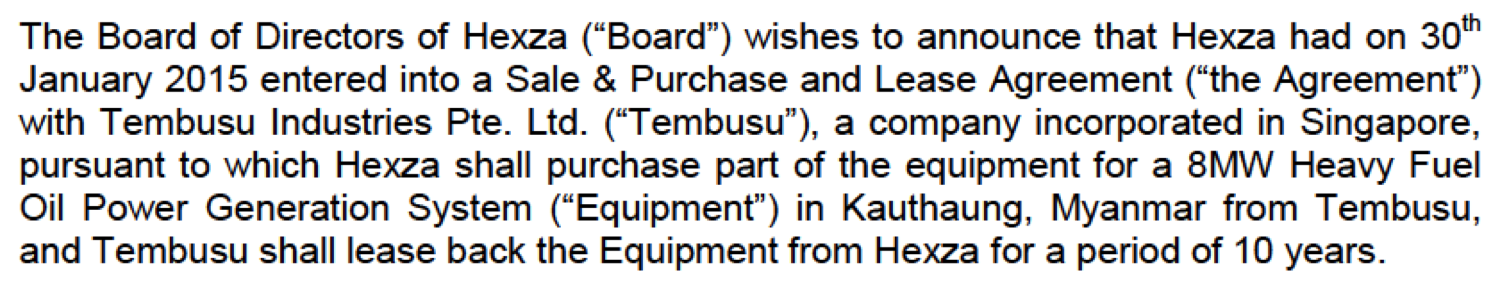
On 11 February 2015, the company announced that it has entered into a buy and leaseback agreement with Tembusu (a Singaporean owned company operating in Myanmar).
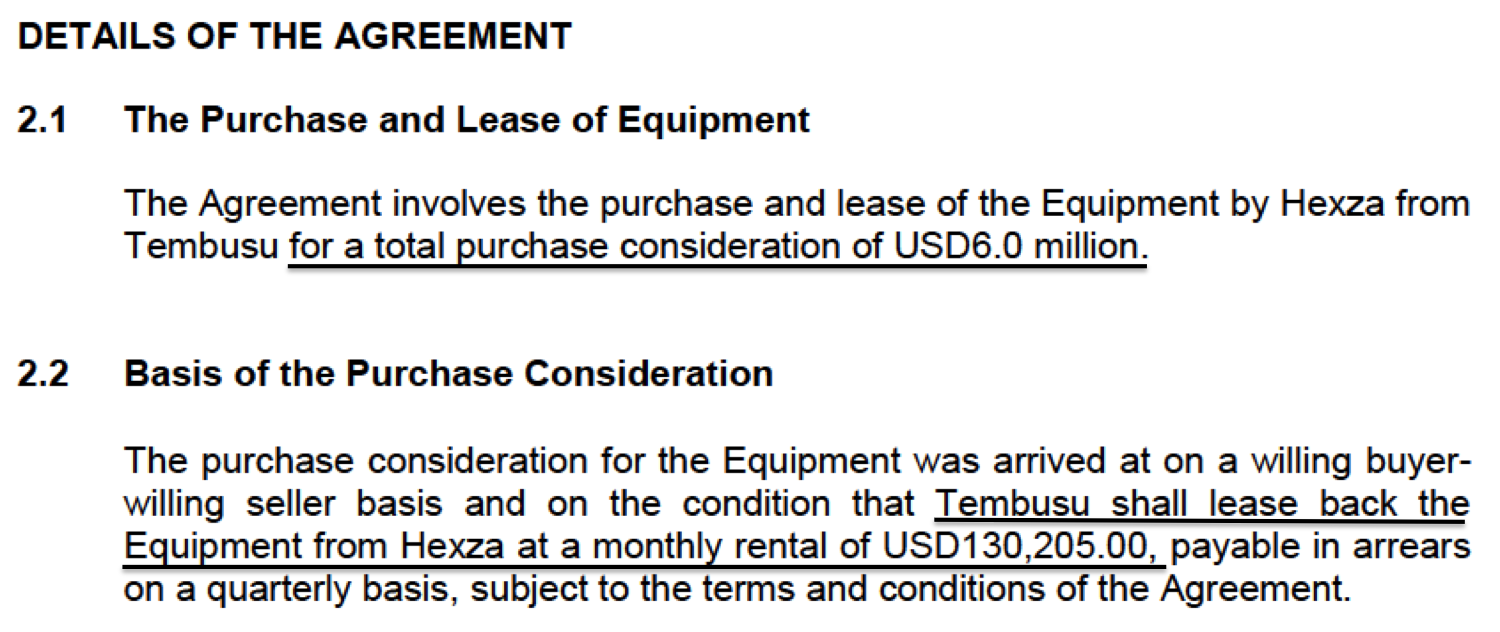
Purchase consideration is RM21 mil (based on USD : RM exchange rate of 3.5). The company will be entitled to payment of USD1.56 mil per annum (equivalent to RM5.0 mil per annum based on assumed long term exchange rate of 3.2)
According to the company, the payback period is 4.5 years. If we assume payback period equals PE multiple, the company is expecting net profit of RM4.7 mil per annum (being RM21 mil / 4.5).
As the group registered net profit of RM14.6 mil in FY2014, the new business venture will increase it by 32% to RM19.3 mil.
Based on net profit of RM19.3 mil, the existing market cap of RM163 mil translates into PER of 8.4 times.
(Note : The above calculation is arrived at based on my assumption that payback period is equivalent to PE multiple. Please seek clarification with the company and / or its advisor in the event that you are interested in investing in the company's stocks. Personally, I don't find the stock very interesting)
No comments:
Post a Comment