Eka Noodles, Ekowood, Emico, Euro, Eurospan
Author: Icon8888 | Publish date: Sat, 7 Feb 2015, 10:41 AM
Eka Noodles Bhd
Previously knows as KBB Resources Bhd
Eka Noodles Bhd (EKA) Snapshot
Open
0.11
|
Previous Close
0.10
| |
Day High
0.11
|
Day Low
0.10
| |
52 Week High
02/20/14 - 0.19
|
52 Week Low
12/1/14 - 0.09
| |
Market Cap
26.4M
|
Average Volume 10 Days
773.1K
| |
EPS TTM
-0.22
|
Shares Outstanding
240.0M
| |
EX-Date
06/20/07
|
P/E TM
--
| |
Dividend
--
|
Dividend Yield
--
|
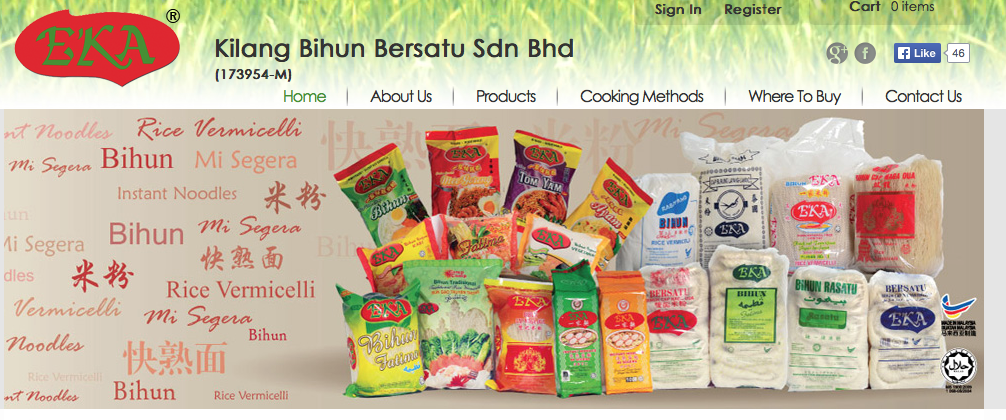
EKA Noodles Berhad, an investment holding company, manufactures and markets various types of rice and sago sticks in Malaysia.

Quarter Result:
| F.Y. | Quarter | Revenue ('000) | Profit before Tax ('000) | Profit Attb. to SH ('000) | EPS (Cent) | DPS (Cent) | NAPS |
|---|---|---|---|---|---|---|---|
| 2015-06-30 | 2014-09-30 | 17,160 | -2,434 | -2,434 | -1.01 | - | 0.0500 |
| 2014-06-30 | 2014-06-30 | 18,453 | -22,319 | -22,229 | -9.26 | - | 0.0600 |
| 2014-06-30 | 2014-03-31 | 23,354 | -11,963 | -11,982 | -4.99 | - | 0.1200 |
| 2014-06-30 | 2013-12-31 | 25,887 | -1,986 | -1,986 | -1.65 | - | 0.1600 |
| 2014-06-30 | 2013-09-30 | 22,643 | -963 | -963 | -0.80 | - | 0.1800 |
| 2013-06-30 | 2013-06-30 | 21,804 | -216 | -216 | -0.18 | - | - |
| 2013-06-30 | 2013-03-31 | 21,774 | 42 | 32 | 0.02 | - | 0.1900 |
| 2013-06-30 | 2012-12-31 | 21,220 | 204 | 204 | 0.17 | - | 0.1900 |
| 2013-06-30 | 2012-09-30 | 32,437 | 205 | 205 | 0.17 | - | 0.1900 |
| 2012-06-30 | 2012-06-30 | 15,850 | -17,760 | -16,827 | -14.02 | - | - |
| 2012-04-30 | 2012-03-31 | 21,602 | 2,184 | 2,184 | 1.82 | - | 0.2700 |
Reasons for massive losses of RM11.9 mil in March 2014 quarter :-
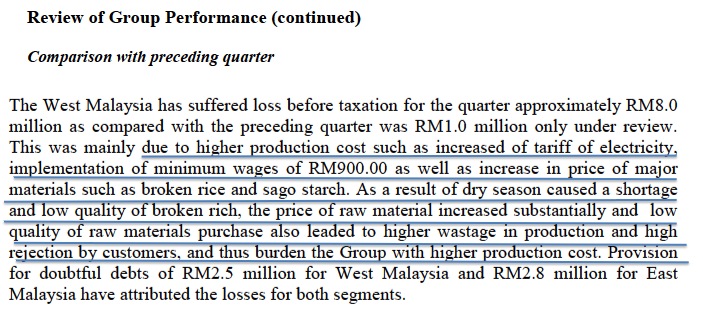
In June 2014 quarter, the group reported even larger losses of RM22.2 mil for more or less the same reasons, plus exceptional items such as doubtful debts, equipment impairment, etc.
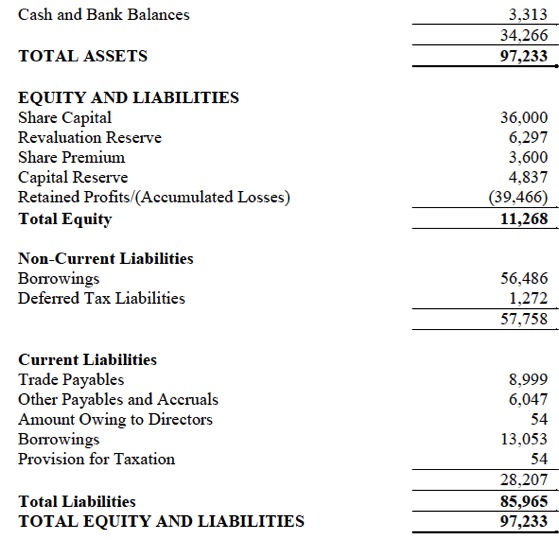
The group has high borrwings while shareholders' funds had almost been depleted. Further losses could result in the company going into PN17.
Avoid
====================================================================================
Ekowood
Ekowood International Bhd (EKOW) Snapshot
Open
0.23
|
Previous Close
0.23
| |
Day High
0.23
|
Day Low
0.23
| |
52 Week High
07/3/14 - 0.36
|
52 Week Low
12/15/14 - 0.17
| |
Market Cap
38.6M
|
Average Volume 10 Days
438.1K
| |
EPS TTM
-0.02
|
Shares Outstanding
168.0M
| |
EX-Date
06/26/08
|
P/E TM
--
| |
Dividend
--
|
Dividend Yield
--
|
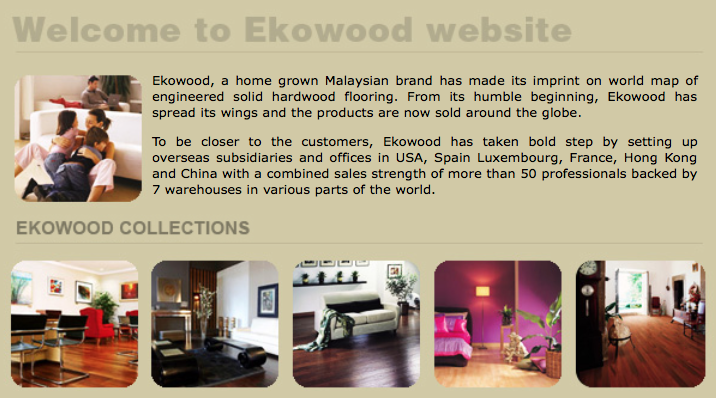
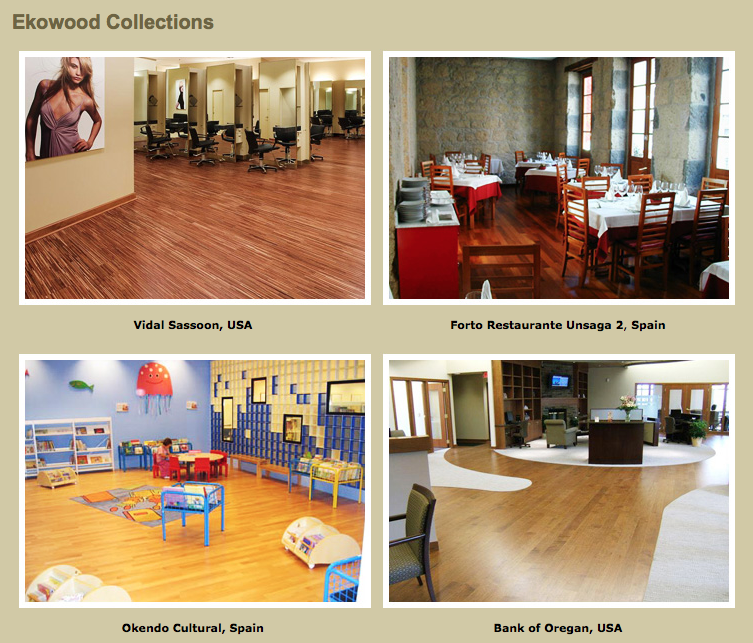
Ekowood International Berhad, together with its subsidiaries, manufactures and sells downstream wood products. The company also supplies and installs timber strips panel flooring; sub-licenses strip lock systems for manufacturing of engineered solid hardwood flooring that uses mechanical locking system; and trades in wood products. It operates in Asia, Europe, Malaysia, the United States, the South-West Pacific, and internationally.


Quarter Result:
| F.Y. | Quarter | Revenue ('000) | Profit before Tax ('000) | Profit Attb. to SH ('000) | EPS (Cent) | DPS (Cent) | NAPS |
|---|---|---|---|---|---|---|---|
| 2014-12-31 | 2014-09-30 | 12,369 | -1,194 | -1,205 | -0.72 | - | 0.6847 |
| 2014-12-31 | 2014-06-30 | 10,573 | -977 | -856 | -0.51 | - | 0.6970 |
| 2014-12-31 | 2014-03-31 | 9,767 | -403 | -369 | -0.22 | - | 0.7047 |
| 2013-12-31 | 2013-12-31 | 11,525 | -1,723 | -1,702 | -1.01 | - | 0.7075 |
| 2013-12-31 | 2013-09-30 | 13,489 | -648 | -636 | -0.38 | - | 0.7149 |
| 2013-12-31 | 2013-06-30 | 12,270 | -707 | -622 | -0.37 | - | 0.7105 |
| 2013-12-31 | 2013-03-31 | 12,829 | -396 | -388 | -0.23 | - | 0.7110 |
| 2012-12-31 | 2012-12-31 | 10,346 | -3,447 | -3,095 | -1.84 | - | - |
| 2012-12-31 | 2012-09-30 | 10,226 | -1,189 | -1,169 | -0.70 | - | 0.7313 |
| 2012-12-31 | 2012-06-30 | 11,394 | -1,365 | -1,316 | -0.78 | - | 0.7399 |
| 2012-12-31 | 2012-03-31 | 9,925 | -946 | -908 | -0.54 | - | 0.7496 |
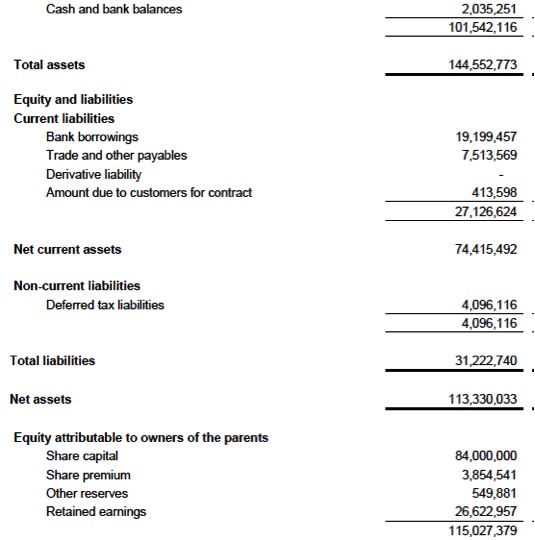
Healthy balance sheets
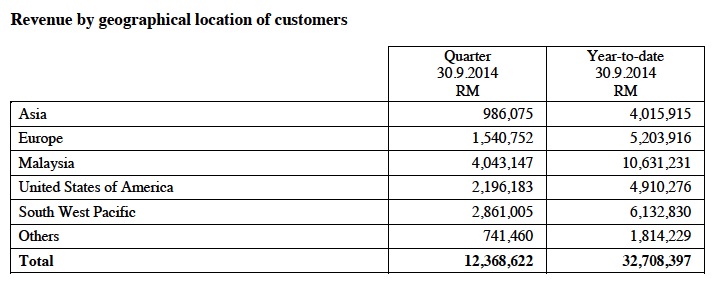
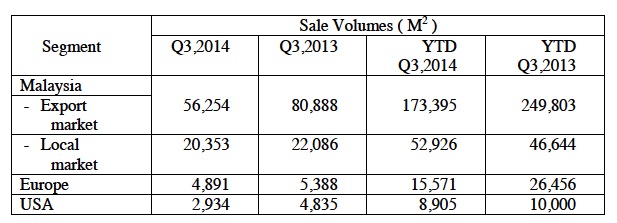
As shown above, the group sold 1/3 of its products in Malaysia while the rest are exported.
Further details of sale destinations :-
Comments
The group has been operating at breakeven level all this while. It would be interesting to see whether the weak Ringgit could deliver stronger results in coming quarters.
=======================================================
Emico Holdings
Emico Holdings Bhd (EMI) Snapshot
Open
0.21
|
Previous Close
0.21
| |
Day High
0.21
|
Day Low
0.20
| |
52 Week High
08/21/14 - 0.32
|
52 Week Low
12/15/14 - 0.17
| |
Market Cap
19.7M
|
Average Volume 10 Days
216.9K
| |
EPS TTM
-0.03
|
Shares Outstanding
95.9M
| |
EX-Date
06/15/98
|
P/E TM
--
| |
Dividend
--
|
Dividend Yield
--
|
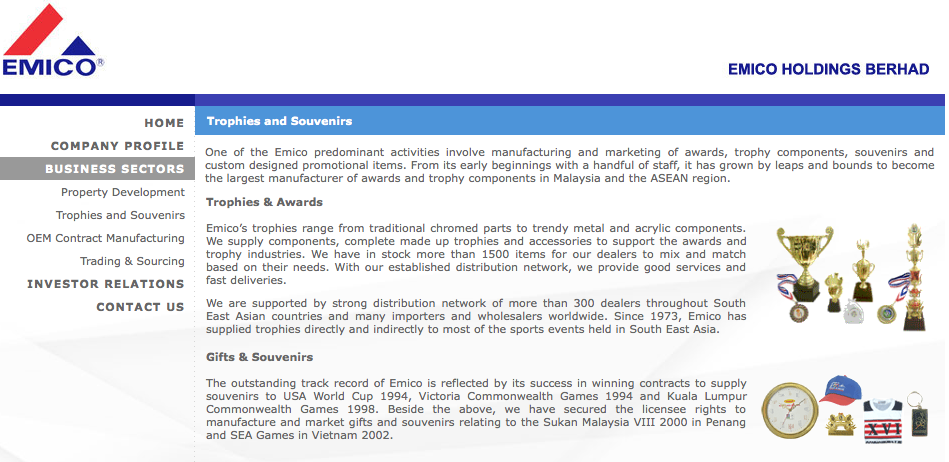
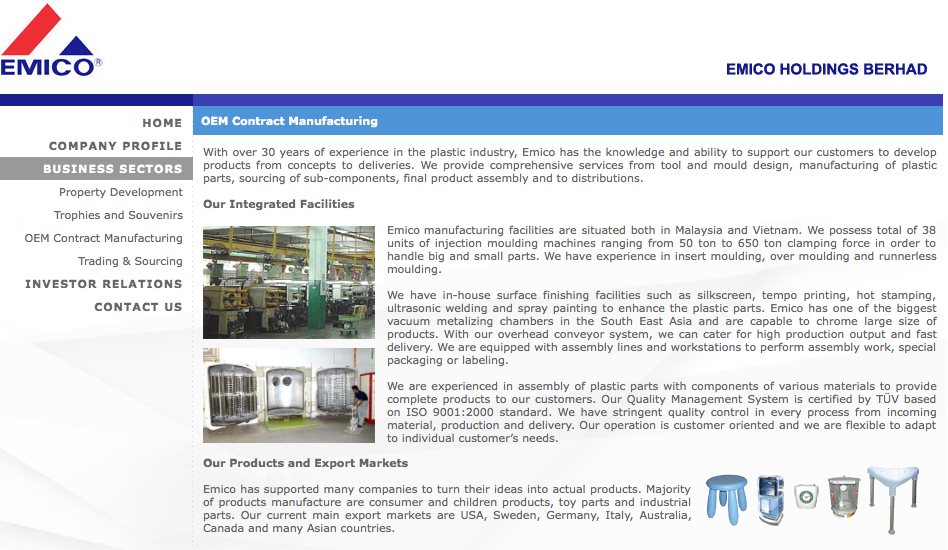
Emico Holdings Berhad, an investment holding company, is engaged in the manufacture and trade of consumable products in Malaysia, Europe, and internationally. It operates through Consumable Products and Property Development segments. The company offers awards, trophy components, medallions, souvenirs, gift items, custom designed promotional items, and furniture products. It also provides original equipment manufacturer contract manufacturing and chroming services.
Quarter Result:
| F.Y. | Quarter | Revenue ('000) | Profit before Tax ('000) | Profit Attb. to SH ('000) | EPS (Cent) | DPS (Cent) | NAPS |
|---|---|---|---|---|---|---|---|
| 2015-03-31 | 2014-09-30 | 15,005 | -743 | -761 | -0.79 | - | 0.3300 |
| 2015-03-31 | 2014-06-30 | 16,637 | -225 | -222 | -0.23 | - | 0.3300 |
| 2014-03-31 | 2014-03-31 | 15,644 | -1,225 | -1,081 | -1.13 | - | 0.3400 |
| 2014-03-31 | 2013-12-31 | 15,269 | -259 | -381 | -0.40 | - | 0.3500 |
| 2014-03-31 | 2013-09-30 | 23,178 | 1,737 | 1,864 | 1.94 | - | 0.3500 |
| 2014-03-31 | 2013-06-30 | 15,171 | -150 | -74 | -0.08 | - | 0.3300 |
| 2013-03-31 | 2013-03-31 | 23,807 | -2,825 | -2,540 | -2.65 | - | - |
| 2013-03-31 | 2012-12-31 | 24,952 | 769 | 767 | 0.80 | - | 0.3600 |
| 2013-03-31 | 2012-09-30 | 11,872 | -88 | -53 | -0.06 | - | 0.3500 |
| 2013-03-31 | 2012-06-30 | 17,032 | -216 | -161 | -0.17 | - | 0.3500 |
| 2012-03-31 | 2012-03-31 | - | - | - | - | - | - |
Comments
The group has relatively healthy balance sheets with minimal gearing. But it has been operating at small losses / breakeven level for a long time. This is probably due to the unexciting prospects of the industry it is in. The stock doesn't look interesting at all.
====================================================
Euro Holdings
Euro Holdings Bhd (EUHO) Snapshot
Open
0.54
|
Previous Close
0.52
| |
Day High
0.54
|
Day Low
0.52
| |
52 Week High
10/28/14 - 0.75
|
52 Week Low
02/6/14 - 0.35
| |
Market Cap
43.3M
|
Average Volume 10 Days
38.4K
| |
EPS TTM
0.03
|
Shares Outstanding
81.0M
| |
EX-Date
06/26/09
|
P/E TM
17.3x
| |
Dividend
--
|
Dividend Yield
--
|
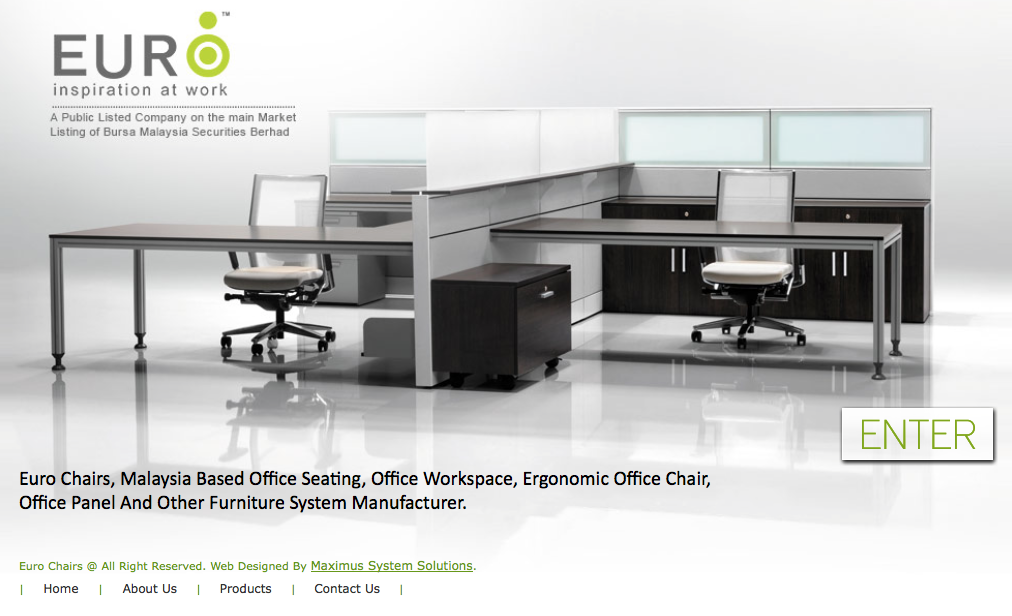
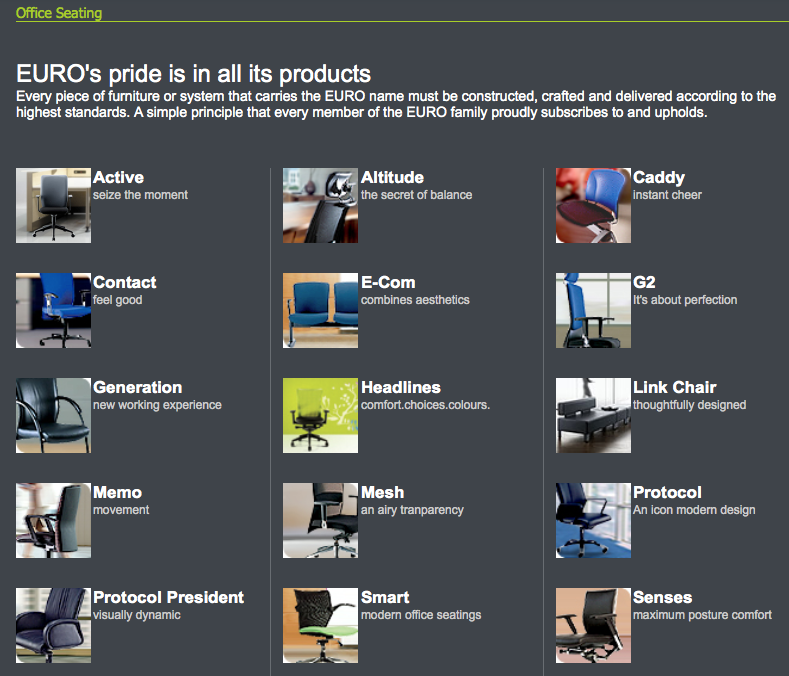
Euro Holdings Berhad manufactures office furniture under the EURO brand in Malaysia and internationally. The company also exports its products to south east Asia, India, Japan, Australia, Europe, the Middle East, and Central and South America. Euro Holdings Berhad was founded in 1976 and is headquartered in Rawang, Malaysia.
Quarter Result:
| F.Y. | Quarter | Revenue ('000) | Profit before Tax ('000) | Profit Attb. to SH ('000) | EPS (Cent) | DPS (Cent) | NAPS |
|---|---|---|---|---|---|---|---|
| 2014-12-31 | 2014-09-30 | 23,663 | -266 | -30 | -0.04 | - | 0.8500 |
| 2014-12-31 | 2014-06-30 | 27,698 | 1,905 | 1,380 | 1.70 | - | 0.8500 |
| 2014-12-31 | 2014-03-31 | 30,308 | 1,398 | 1,095 | 1.32 | - | 0.8300 |
| 2013-12-31 | 2013-12-31 | 26,842 | 1,357 | 94 | 0.12 | - | 0.8200 |
| 2013-12-31 | 2013-09-30 | 22,156 | -933 | -1,149 | -1.42 | - | 0.8200 |
| 2013-12-31 | 2013-06-30 | 24,046 | -664 | -838 | -1.04 | - | 0.8300 |
| 2013-12-31 | 2013-03-31 | 24,171 | 267 | 184 | 0.23 | - | 0.8400 |
| 2012-12-31 | 2012-12-31 | 27,667 | 1,966 | - | 2.40 | - | - |
| 2012-12-31 | 2012-09-30 | 27,798 | 1,737 | 1,118 | 1.38 | - | 0.8100 |
| 2012-12-31 | 2012-06-30 | 29,367 | 1,559 | 1,534 | 1.89 | - | 0.8000 |
| 2012-12-31 | 2012-03-31 | 18,340 | -3,162 | -3,120 | -3.85 | - | 0.7800 |
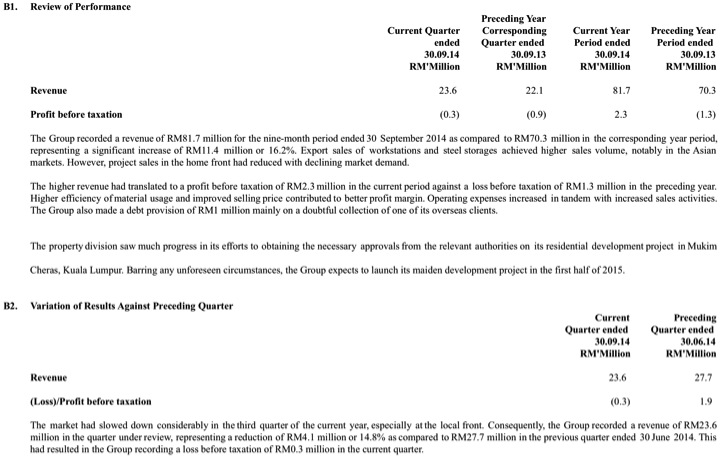
The group exports almost 50% of its products :-
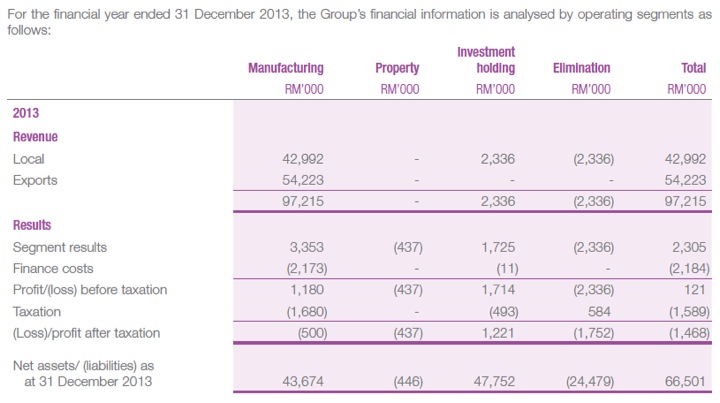
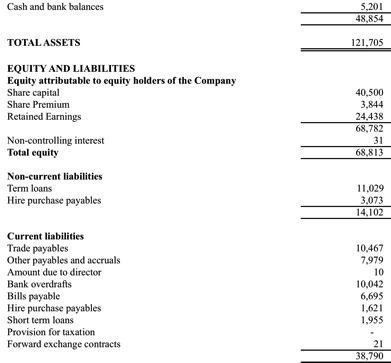
The group has net gearing of 0.24 times :-
Comments
(a) The group manufactures office furnitures. It exports 50% of its products.
(b) From historical profitability point of view, it is not a very well run company. However, the strong US dollars should boast earnings in coming quarters.
(c) However, PER now is approximately 17 times. There are many other better furniture companies around.
============================================================================
Eurospan
Eurospan Holdings Berhad (EURO) Snapshot
Open
0.80
|
Previous Close
0.80
| |
Day High
0.80
|
Day Low
0.80
| |
52 Week High
08/21/14 - 1.17
|
52 Week Low
12/9/14 - 0.62
| |
Market Cap
35.5M
|
Average Volume 10 Days
35.1K
| |
EPS TTM
0.06
|
Shares Outstanding
44.4M
| |
EX-Date
01/6/11
|
P/E TM
13.2x
| |
Dividend
--
|
Dividend Yield
--
|
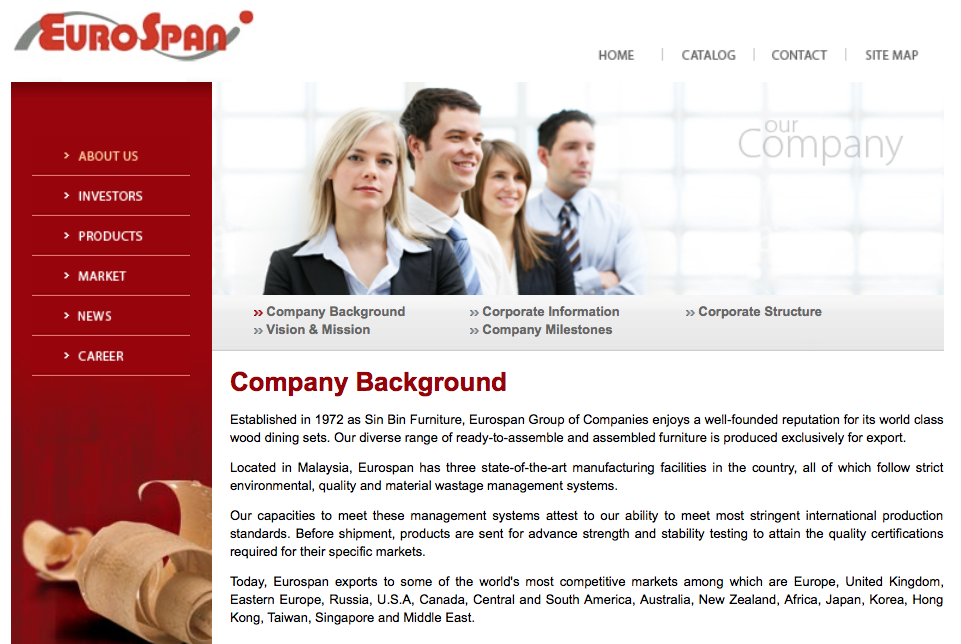
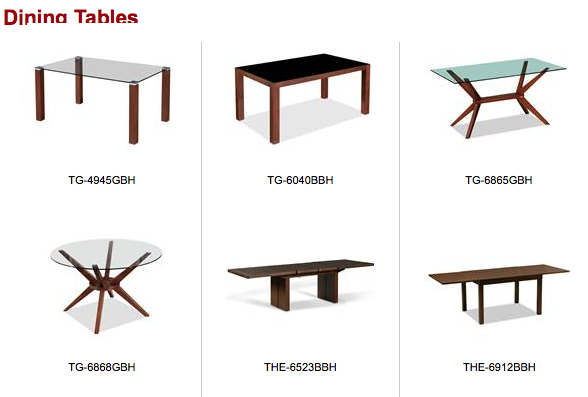
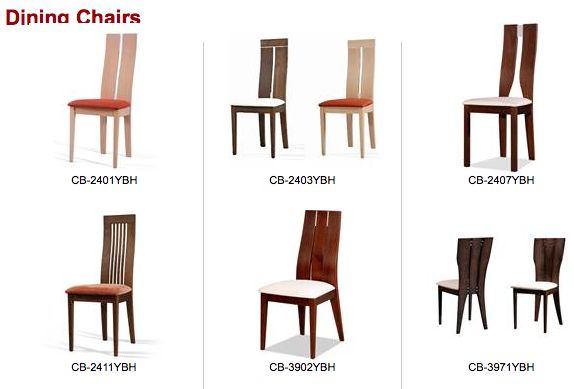
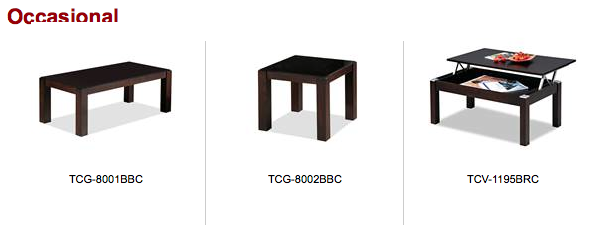
Eurospan Holdings Berhad, an investment holding company, manufactures and trades in furniture and wood-based products primarily in Malaysia. It offers ready-to-assemble and assembled furniture products, such as dining tables, dining chairs, cabinets, settings, and occasional wood products. The company also exports its products. Eurospan Holdings Berhad was founded in 1972 and is based in Butterworth, Malaysia.
Quarter Result:
| F.Y. | Quarter | Revenue ('000) | Profit before Tax ('000) | Profit Attb. to SH ('000) | EPS (Cent) | DPS (Cent) | NAPS |
|---|---|---|---|---|---|---|---|
| 2015-05-31 | 2014-11-30 | 14,103 | -309 | -244 | -0.55 | - | 1.0778 |
| 2015-05-31 | 2014-08-31 | 15,160 | 489 | 372 | 0.84 | - | 1.0833 |
| 2014-05-31 | 2014-05-31 | 14,691 | 2,152 | 1,645 | 3.70 | - | 1.0750 |
| 2014-05-31 | 2014-02-28 | 15,922 | 1,286 | 910 | 2.05 | - | 1.0380 |
| 2014-05-31 | 2013-11-30 | 17,464 | 1,968 | 1,563 | 3.52 | - | 1.0175 |
| 2014-05-31 | 2013-08-31 | 17,118 | 1,444 | 1,560 | 3.51 | - | 0.9823 |
| 2013-05-31 | 2013-05-31 | 14,887 | 1,170 | 1,103 | 2.48 | - | - |
| 2013-05-31 | 2013-02-28 | 12,685 | 276 | 275 | 0.62 | - | 0.9222 |
| 2013-05-31 | 2012-11-30 | 15,513 | 694 | 603 | 1.36 | - | 0.9160 |
| 2013-05-31 | 2012-08-31 | 17,818 | 1,534 | 1,256 | 2.83 | - | 0.9025 |
| 2012-05-31 | 2012-05-31 | 15,949 | -4,503 | -4,506 | -10.14 | - | - |
| 2012-05-31 | 2012-02-29 | 15,742 | 1,141 | 1,570 | 3.53 | - | 0.9753 |
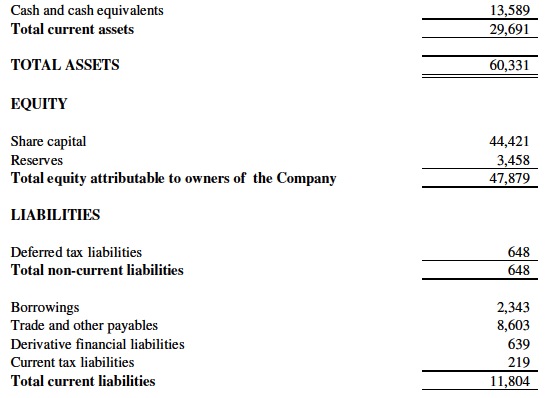
Strong balance sheets :-
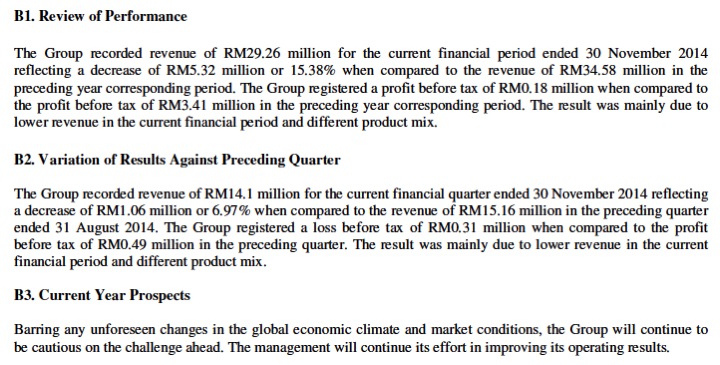
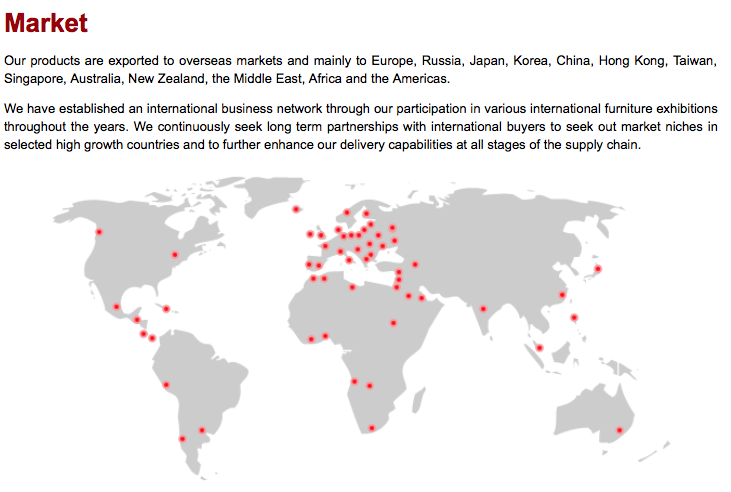
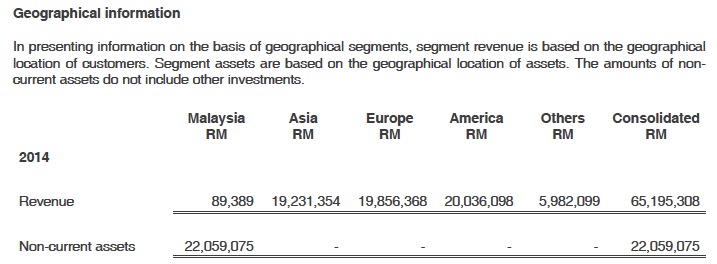
Almost the entire 100% of the grouyp's products are exported :-
Comments
This group does looked interesting. Market cap is small. Gearing is low. Even without the help of weak Ringgit, it has been able to produce reaosnably good results in the past. Earnings in coming quarters should get a boast from the strong US dollars
No comments:
Post a Comment