Notion VTEC, Omesti, Panpage, Pentamaster, Theta Edge
Author: Icon8888 | Publish date: Fri, 6 Feb 2015, 12:56 PM
Notion Vtec
Notion Vtec Bhd (NVB) Snapshot
Open
0.44
|
Previous Close
0.45
| |
Day High
0.44
|
Day Low
0.44
| |
52 Week High
07/23/14 - 0.75
|
52 Week Low
12/16/14 - 0.34
| |
Market Cap
118.0M
|
Average Volume 10 Days
71.0K
| |
EPS TTM
-0.10
|
Shares Outstanding
268.3M
| |
EX-Date
12/23/13
|
P/E TM
--
| |
Dividend
--
|
Dividend Yield
--
|
Quarter Result:
| F.Y. | Quarter | Revenue ('000) | Profit before Tax ('000) | Profit Attb. to SH ('000) | EPS (Cent) | DPS (Cent) | NAPS |
|---|---|---|---|---|---|---|---|
| 2014-09-30 | 2014-09-30 | 55,320 | -15,912 | -9,522 | 3.55 | - | 1.1048 |
| 2014-09-30 | 2014-06-30 | 52,190 | 961 | 1,265 | 0.47 | - | 1.1349 |
| 2014-09-30 | 2014-03-31 | 44,201 | -8,709 | -7,379 | -2.75 | - | 1.1280 |
| 2014-09-30 | 2013-12-31 | 47,706 | -9,453 | -10,023 | -3.74 | - | 1.1520 |
| 2013-09-30 | 2013-09-30 | 60,178 | 2,998 | 296 | 0.11 | 1.00 | - |
| 2013-09-30 | 2013-06-30 | 62,156 | 45,323 | 40,133 | 14.96 | - | 1.1835 |
| 2013-09-30 | 2013-03-31 | 50,841 | 3,571 | 2,387 | 0.90 | - | 1.0640 |
| 2013-09-30 | 2012-12-31 | 49,140 | -22,380 | -22,728 | -8.61 | - | 1.0763 |
| 2012-09-30 | 2012-09-30 | 88,860 | 21,311 | 18,722 | 6.94 | 2.00 | - |
| 2012-09-30 | 2012-06-30 | 95,829 | 24,022 | 19,836 | 7.35 | 1.00 | 1.1047 |
| 2012-09-30 | 2012-03-31 | 84,508 | 16,595 | 15,537 | 10.06 | - | 1.8031 |
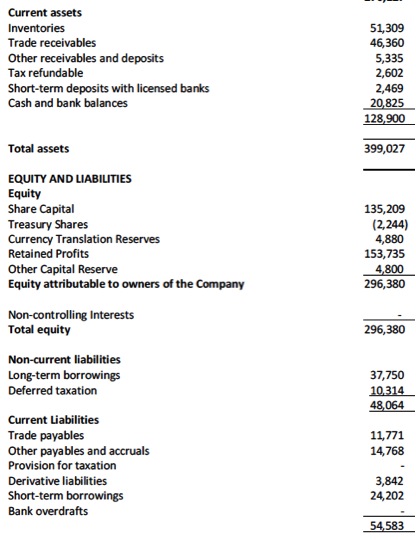
Strong balance sheets
Comments
(1) This group is quite huge, with net assets of RM296 mil.
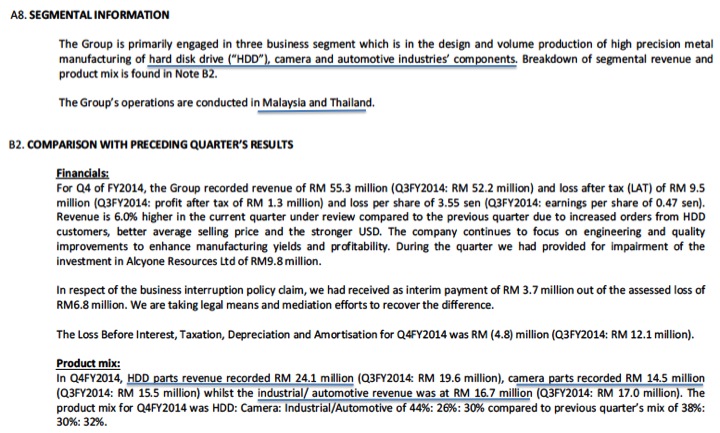
(2) Used to do well. But in recent years, had been reporting losses most of the time.
(3) Three business egments - HDD parts, camera parts and industrial / automotive parts.
(4) Not exciting until there are signs of turning around.
=================================================================
Omesti
Previously known as Formis Resources
Omesti Bhd (OMST) Snapshot
Open
0.53
|
Previous Close
0.54
| |
Day High
0.54
|
Day Low
0.53
| |
52 Week High
03/25/14 - 0.88
|
52 Week Low
12/16/14 - 0.50
| |
Market Cap
207.3M
|
Average Volume 10 Days
65.2K
| |
EPS TTM
0.08
|
Shares Outstanding
387.5M
| |
EX-Date
07/4/96
|
P/E TM
7.0x
| |
Dividend
--
|
Dividend Yield
--
|
Quarter Result:
| F.Y. | Quarter | Revenue ('000) | Profit before Tax ('000) | Profit Attb. to SH ('000) | EPS (Cent) | DPS (Cent) | NAPS |
|---|---|---|---|---|---|---|---|
| 2015-03-31 | 2014-09-30 | 120,938 | 1,573 | -1,548 | -0.40 | - | 0.6708 |
| 2015-03-31 | 2014-06-30 | 94,037 | 1,610 | 1,086 | 0.28 | - | 0.6672 |
| 2014-03-31 | 2014-03-31 | 88,529 | 16,076 | 14,120 | 4.14 | - | 0.6574 |
| 2014-03-31 | 2013-12-31 | 105,425 | 13,005 | 11,670 | 3.59 | - | 0.6323 |
| 2014-03-31 | 2013-09-30 | 88,332 | 6,204 | 4,556 | 1.52 | - | 0.5951 |
| 2014-03-31 | 2013-06-30 | 69,312 | 883 | 545 | 0.22 | - | 0.6260 |
| 2013-03-31 | 2013-03-31 | 109,668 | -34,127 | -37,625 | -20.24 | - | - |
| 2013-03-31 | 2012-12-31 | 79,527 | 2,414 | 67 | 0.04 | - | 0.9513 |
| 2013-03-31 | 2012-09-30 | 75,490 | 2,372 | 1,483 | 0.80 | - | 0.9472 |
| 2013-03-31 | 2012-06-30 | 73,948 | -2,838 | -4,080 | -2.19 | - | 0.9380 |
| 2012-03-31 | 2012-03-31 | 84,283 | -11,333 | -19,165 | -10.31 | - | - |
(1) December 2013 quarter's net profit of RM11.7 mil was mostly due to fair value gain for investment amounting to RM9.2 mil
(2) March 2014 quarter's net profit was mainly due to RM13.4 mil gain from partial disposal of associate company stake, and RM4.5 mil fair value gain for investment.

Relatively healthy balance sheets with limited gearing
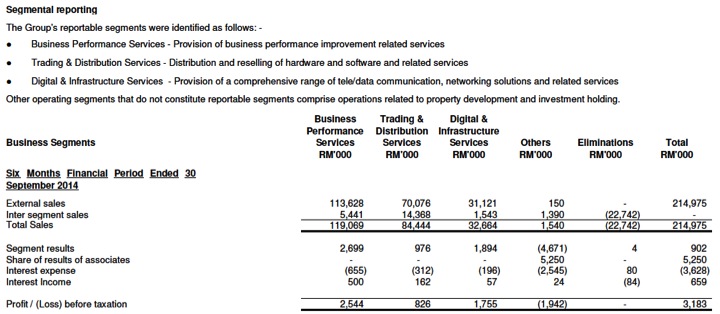
Comments
(1) Parent company of ISS Consulting (100%) and ACE listed Microlink (50%, worthed RM35 mil) and Diversified Gateway (60%, worthed RM77 mil). The company also owns 16.8% of Main Market listed Ho Hup (worth RM80 mil).
(2) The group has huge asset base, with net assets of RM260 mil. Have strong balance sheet with low net gearing. However, as can be seen from segmental breakdown, the various divisions generated limited profit (approximately RM5 to 10 mil per annum).
(3) With market cap of RM207 mil, the stock is overvalued. Not exciting until there are signs of turning around.
===============================================================================
Panpage
Panpages Bhd (PAN) Snapshot
Open
0.31
|
Previous Close
0.31
| |
Day High
0.31
|
Day Low
0.31
| |
52 Week High
09/29/14 - 0.43
|
52 Week Low
01/7/15 - 0.29
| |
Market Cap
73.6M
|
Average Volume 10 Days
212.9K
| |
EPS TTM
-0.0089
|
Shares Outstanding
241.4M
| |
EX-Date
09/26/13
|
P/E TM
--
| |
Dividend
--
|
Dividend Yield
--
|
Quarter Result:
| F.Y. | Quarter | Revenue ('000) | Profit before Tax ('000) | Profit Attb. to SH ('000) | EPS (Cent) | DPS (Cent) | NAPS |
|---|---|---|---|---|---|---|---|
| 2014-12-31 | 2014-09-30 | 8,189 | -1,143 | -1,077 | -0.45 | - | 0.2843 |
| 2014-12-31 | 2014-06-30 | 8,739 | 730 | 790 | 0.33 | - | 0.2899 |
| 2014-12-31 | 2014-03-31 | 4,363 | -3,595 | -3,514 | -1.46 | - | 0.2868 |
| 2013-12-31 | 2013-12-31 | 11,431 | 2,859 | 1,634 | 0.69 | - | 0.3100 |
| 2013-12-31 | 2013-09-30 | 10,361 | 2,470 | 2,551 | 1.14 | - | 0.3026 |
| 2013-12-31 | 2013-06-30 | 7,636 | 1,313 | 1,375 | 0.57 | 2.00 | 0.3121 |
| 2013-12-31 | 2013-03-31 | 4,541 | -1,359 | -1,054 | -0.44 | - | 0.3078 |
| 2012-12-31 | 2012-12-31 | 17,604 | 4,185 | 4,663 | 1.94 | - | - |
| 2012-12-31 | 2012-09-30 | 14,256 | 3,418 | 3,358 | 1.40 | - | 0.2912 |
| 2012-12-31 | 2012-06-30 | 11,649 | 2,907 | 2,810 | 1.17 | 2.50 | 0.2767 |
| 2012-12-31 | 2012-03-31 | 8,538 | 1,162 | 979 | 0.41 | - | 0.2896 |
The company operates principally through Information Technology and Search & Advertising segments.
Information Technology division Provides radio frequency identification solutions for businesses by integrating software, hardware, maintenance, and support services.
e-Security solutions, such as Paymate Secure Suite, a security platform designed to manage data transmissions through unsecure networks.
e-Procurement Suite, a platform that automates the value chain of the purchasing proces; and cloud computing and infrastructure solutions.
Further, it is engaged in the distribution of software products; development of Web portals; and provision of computer programming services.
Search and Advertising division The company's online business platform operates as a specialized Internet search engine that allows users to search a structured database of local businesses using geographic parameters under the brand name of PanPages.com.
It also prints business directories for commercial and industrial business users; offers online advertising and marketing services through the use of Google Adwords services; resells third party online advertisement products for Google, Alibaba, and Facebook, as well as other Internet advertisement solutions; and is engaged in content development business.

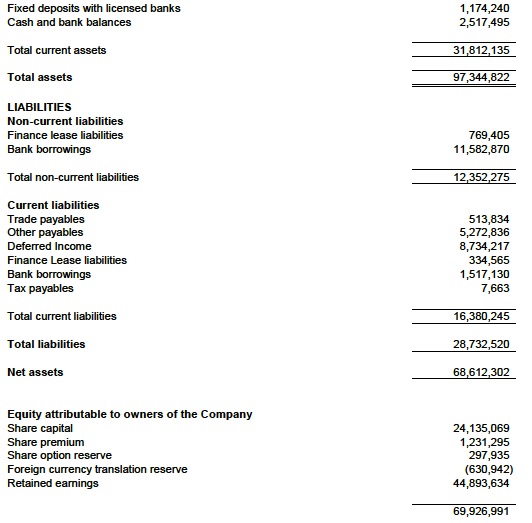
As shown above, the group has healthy balance sheet with net gearing of 0.13 times.

As shown above, it seemed that the bulk of the group's revenue nowadays is derived from Search & Advertising.


According to management's explanation above, the decline in profitability of Sale & Advertising is due to lower sales from the print business directory division. The online products continued to do well with revenue growth in latest quarter.
Higher expenses was due to commencement of operations of certain subsidiaries in Thailand and Indonesia.
Comments
(a) Panpage was previously known as CBSA Bhd (CBS Technology Bhd) and specialised in provision of RFID related IT solutions. However, in recent years, they ventured into sale and advertising business (involving both print and online) ("SA Business"). This new division has now become the dominant revenue contributor to the group.
(b) In March 2013, the group received an offer from a private equity firm to acquire the SA Business for cash consideration of RM120 mil, equivalent to RM50 sen per share. The deal was subsequently called off after both sides failed to reach agreement on terms and conditions.
(c) I have briefly gone through the Panpage website. It reminded me of Alibaba. It allows a user to search for suppliers for merchandises they are interested in.
(d) As usual, the purpose of this study is to get a general overview of the group. I will only undertake a more detailed study once the group has reported sustainable turnaround. But the group seemed to be maintaining momentum for its online business (print directory experienced decline). Will continue to keep track of this company especially its quarterly results.
=====================================================================================
Pentamaster
Pentamaster Corp Bhd (PENT) Snapshot
Open
0.52
|
Previous Close
0.52
| |
Day High
0.53
|
Day Low
0.51
| |
52 Week High
02/5/15 - 0.54
|
52 Week Low
03/3/14 - 0.21
| |
Market Cap
68.6M
|
Average Volume 10 Days
5.6M
| |
EPS TTM
0.02
|
Shares Outstanding
133.2M
| |
EX-Date
07/11/08
|
P/E TM
24.4x
| |
Dividend
--
|
Dividend Yield
--
|
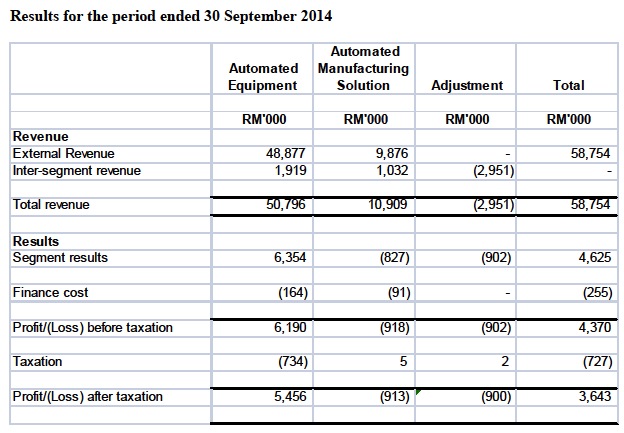
Pentamaster group designs, assembles, and installs computerized automation systems and equipment in Malaysia, the People’s Republic of China, the United States, the Philippines, Taiwan, Singapore, South Korea, and internationally. The company operates through two segments, Automated Equipment and Automated Manufacturing Solutions.

Quarter Result:
| F.Y. | Quarter | Revenue ('000) | Profit before Tax ('000) | Profit Attb. to SH ('000) | EPS (Cent) | DPS (Cent) | NAPS |
|---|---|---|---|---|---|---|---|
| 2014-12-31 | 2014-09-30 | 22,307 | 2,439 | 2,011 | 1.51 | - | 0.4463 |
| 2014-12-31 | 2014-06-30 | 26,689 | 2,544 | 1,607 | 1.21 | - | 0.4311 |
| 2014-12-31 | 2014-03-31 | 9,758 | -613 | -1,082 | -0.81 | - | 0.4189 |
| 2013-12-31 | 2013-12-31 | 16,698 | 1,053 | 272 | 0.20 | - | 0.4269 |
| 2013-12-31 | 2013-09-30 | 12,161 | 463 | 48 | 0.04 | - | 0.4252 |
| 2013-12-31 | 2013-06-30 | 17,293 | 854 | 407 | 0.31 | - | 0.4230 |
| 2013-12-31 | 2013-03-31 | 21,192 | 1,548 | 1,682 | 1.26 | - | 0.4172 |
| 2012-12-31 | 2012-12-31 | 16,159 | -1,884 | -1,445 | -1.08 | - | - |
| 2012-12-31 | 2012-09-30 | 15,775 | 538 | 606 | 0.45 | - | 0.4199 |
| 2012-12-31 | 2012-06-30 | 15,049 | 545 | 542 | 0.41 | - | 0.4159 |
| 2012-12-31 | 2012-03-31 | 9,913 | -1,282 | -1,036 | -0.78 | - | 0.4120 |
The group returned to profitability since June 2014 quarter. In September 2014 quarter, results improved further.
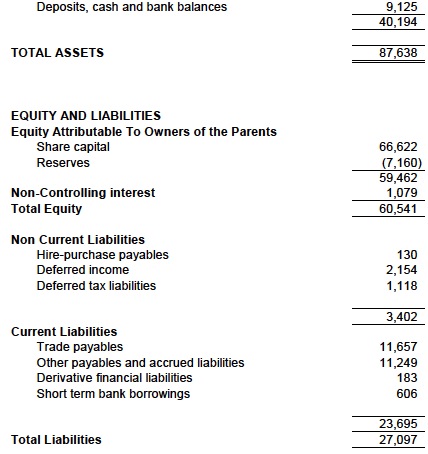
Healthy balance sheets


Comments
(a) Pentamaster's case is very simple and easy to understand. The group is involved in manufacturing of automated equipment / systems for semiconductor manuafcturers. Since June 2014 quarter, the group has returned to profitability. Earnings improved further in September 2014 quarter.
(b) Going forward, earnings is expected to improve further as the semiconductor industry is currently doing very well, driven by , inter-alia, strong demand from smartphone manufacturers.
(c) Based on estimated sustainable EPS of let's say, 6 sen, the stock is trading at approximately 8.3 times PER. Strictly speaking, it is still good value for money.
======================================================================
Theta Edge
Theta Edge Bhd (THETA) Snapshot
Open
0.30
|
Previous Close
0.30
| |
Day High
0.30
|
Day Low
0.30
| |
52 Week High
06/25/14 - 0.65
|
52 Week Low
12/15/14 - 0.20
| |
Market Cap
32.2M
|
Average Volume 10 Days
20.8K
| |
EPS TTM
-0.07
|
Shares Outstanding
107.2M
| |
EX-Date
10/20/09
|
P/E TM
--
| |
Dividend
--
|
Dividend Yield
--
|
Quarter Result:
| F.Y. | Quarter | Revenue ('000) | Profit before Tax ('000) | Profit Attb. to SH ('000) | EPS (Cent) | DPS (Cent) | NAPS |
|---|---|---|---|---|---|---|---|
| 2014-12-31 | 2014-09-30 | 25,975 | 2,862 | -1,722 | -1.61 | - | 0.6000 |
| 2014-12-31 | 2014-06-30 | 24,205 | -2,518 | -2,518 | -2.35 | - | 0.6100 |
| 2014-12-31 | 2014-03-31 | 12,923 | -2,828 | -2,828 | -2.64 | - | 0.6400 |
| 2013-12-31 | 2013-12-31 | 21,488 | -517 | -522 | -0.49 | - | 0.6600 |
| 2013-12-31 | 2013-09-30 | 41,001 | -2,613 | -2,613 | -2.44 | - | 0.6700 |
| 2013-12-31 | 2013-06-30 | 19,390 | -1,601 | -1,601 | -1.49 | - | 0.6900 |
| 2013-12-31 | 2013-03-31 | 13,024 | -3,281 | -3,281 | -3.06 | - | 0.7100 |
| 2012-12-31 | 2012-12-31 | 23,266 | 1,604 | 1,584 | 1.48 | - | - |
| 2012-12-31 | 2012-09-30 | 15,630 | -4,368 | -4,412 | -4.11 | - | 0.7200 |
| 2012-12-31 | 2012-06-30 | 17,026 | -2,650 | -2,650 | -2.47 | - | 0.7700 |
| 2012-12-31 | 2012-03-31 | 19,370 | -1,492 | -1,494 | -1.39 | - | 0.7900 |
Theta Edge Berhad, an investment holding company, provides information communication and technology services in Malaysia. It operates as a dealer, software writer, compiler and tester, system developer, trainer, and consultant in computers and services related to information technology industry, as well as operates as a public mobile data network operator.
Comments
The group is loss making
Just received a check for $500.
ReplyDeleteSometimes people don't believe me when I tell them about how much you can earn by taking paid surveys online...
So I took a video of myself getting paid over $500 for participating in paid surveys to set the record straight once and for all.