CAB Cakaran, Caely, Cam Resources
Author: Icon8888 | Publish date: Sun, 8 Feb 2015, 03:35 PM
CAB Cakaran
Cab Cakaran Corp Bhd (CABC) Snapshot
Open
0.96
|
Previous Close
0.97
| |
Day High
0.98
|
Day Low
0.96
| |
52 Week High
01/26/15 - 1.21
|
52 Week Low
04/1/14 - 0.45
| |
Market Cap
127.0M
|
Average Volume 10 Days
1.3M
| |
EPS TTM
0.08
|
Shares Outstanding
131.6M
| |
EX-Date
03/24/06
|
P/E TM
11.4x
| |
Dividend
--
|
Dividend Yield
--
|

Quarter Result:
| F.Y. | Quarter | Revenue ('000) | Profit before Tax ('000) | Profit Attb. to SH ('000) | EPS (Cent) | DPS (Cent) | NAPS |
|---|---|---|---|---|---|---|---|
| 2014-09-30 | 2014-09-30 | 179,207 | 11,123 | 6,710 | 5.10 | - | 1.1600 |
| 2014-09-30 | 2014-06-30 | 170,366 | 533 | -1 | - | - | 1.1100 |
| 2014-09-30 | 2014-03-31 | 163,903 | 5,531 | 3,284 | 2.50 | - | 1.1100 |
| 2014-09-30 | 2013-12-31 | 158,936 | 1,869 | 1,174 | 0.89 | - | 1.0800 |
| 2013-09-30 | 2013-09-30 | 170,525 | 13,746 | 10,534 | 8.01 | - | - |
| 2013-09-30 | 2013-06-30 | 150,586 | 3,556 | 2,173 | 1.65 | - | 0.9900 |
| 2013-09-30 | 2013-03-31 | 149,879 | -616 | 145 | 0.11 | - | 0.9800 |
| 2013-09-30 | 2012-12-31 | 138,010 | -1,064 | -916 | -0.70 | - | 0.9800 |
| 2012-09-30 | 2012-09-30 | 137,421 | 7,075 | 3,830 | 2.91 | - | - |
| 2012-09-30 | 2012-06-30 | 129,683 | -1,012 | -1,975 | -1.50 | - | 0.6900 |
| 2012-09-30 | 2012-03-31 | 130,783 | -8,561 | -6,543 | -4.97 | - | 0.7000 |
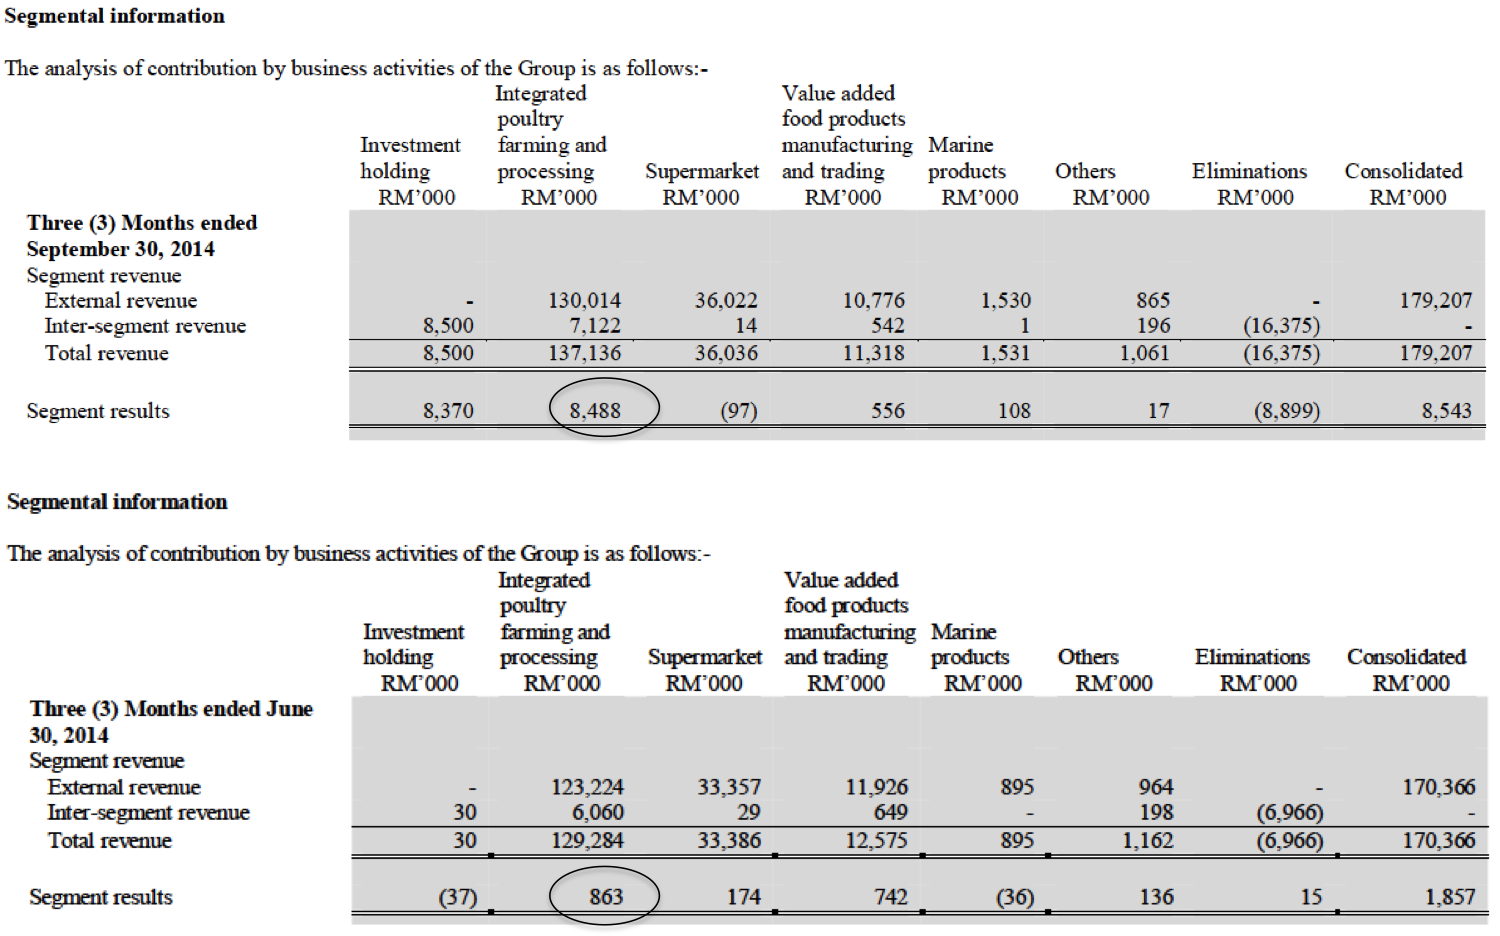
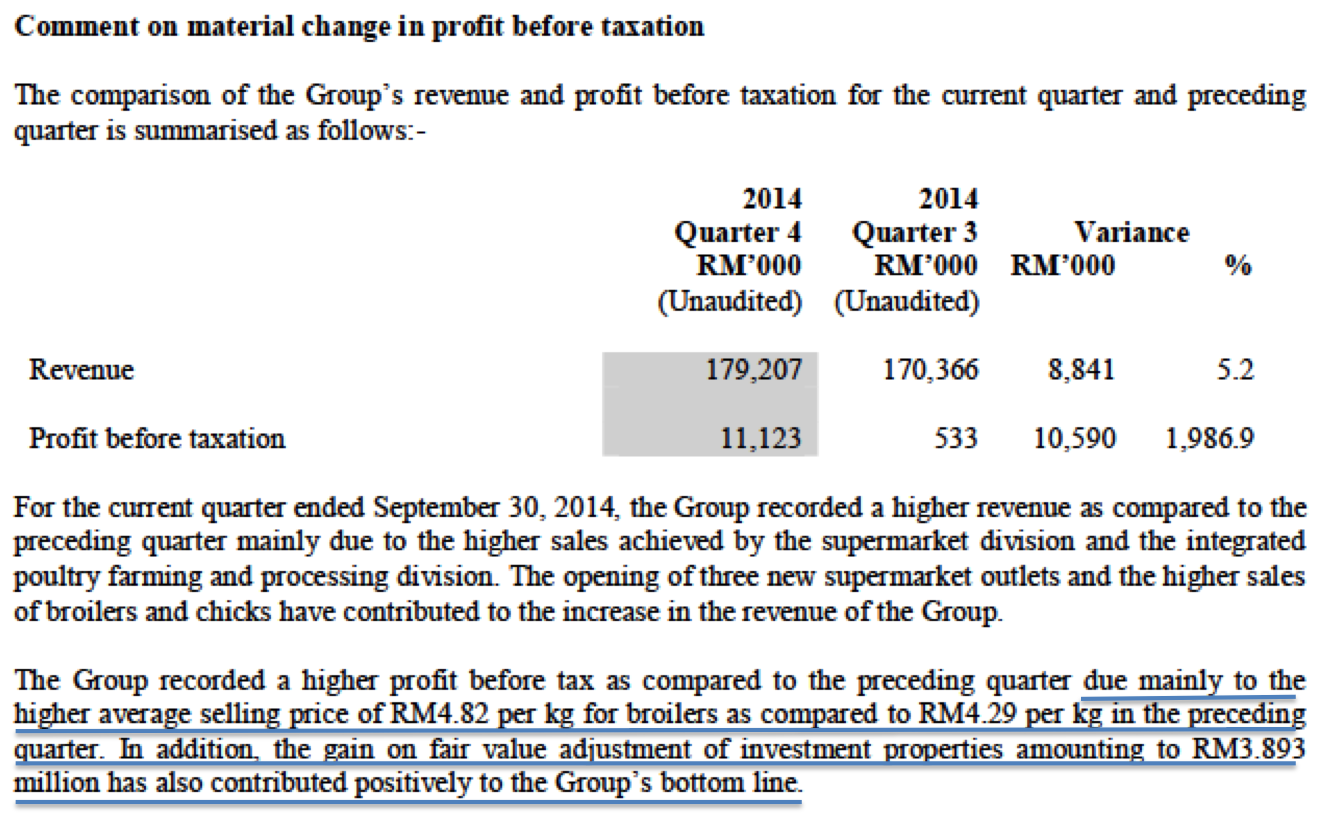
From the table above, it seemed that there is a seasonal pattern, with September quarter being the strongest. The group actually reported a small loss in its June 2014 quarter. According to the company's explanation, this was primarily due to higher broiler selling price during the September quarter (and revaluation gain of RM3.9 mil)
Almost all the products are sold in Malaysia.
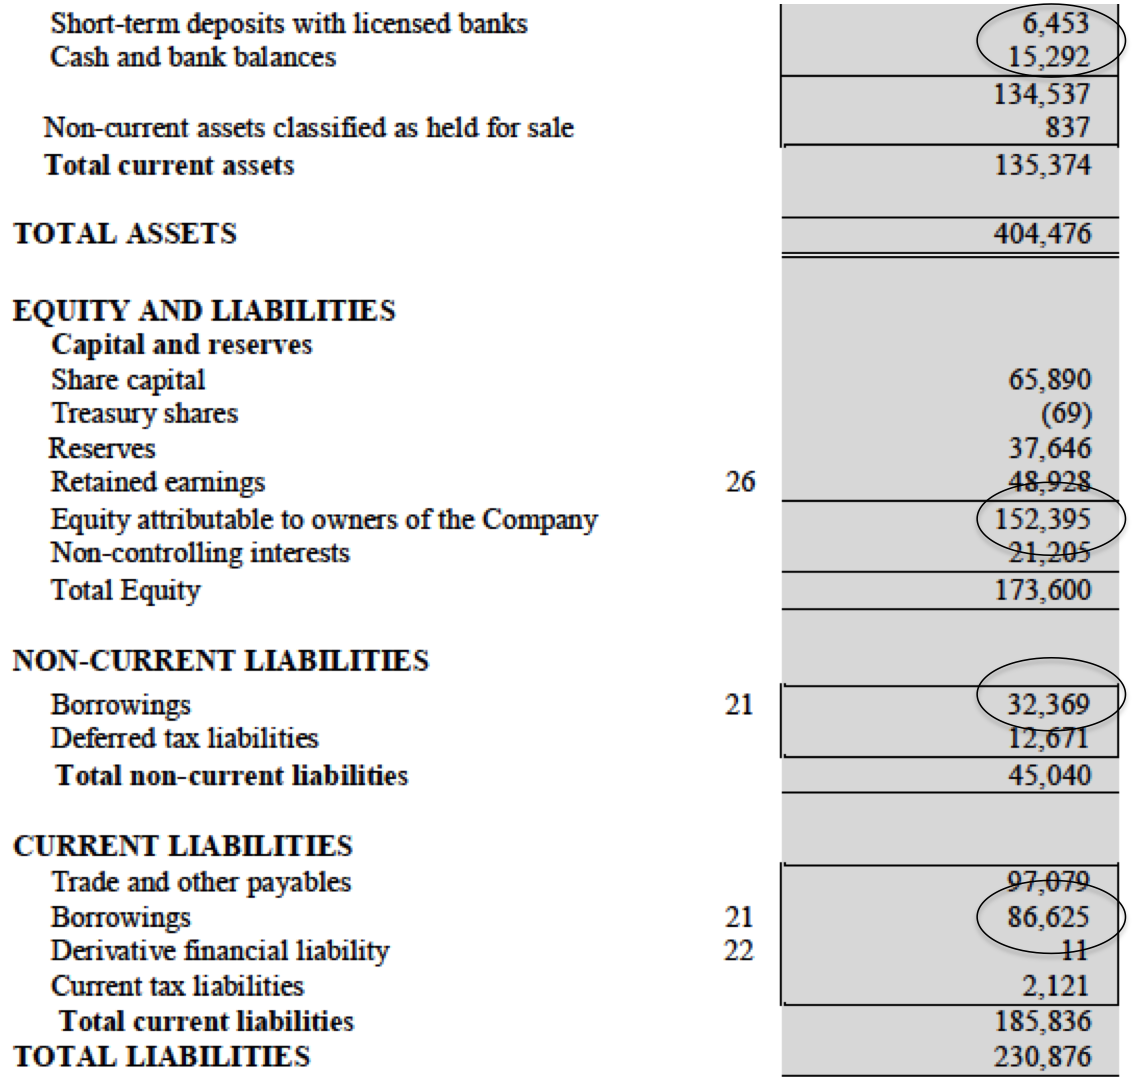
Reltivaly high net gearing at 0.67 times :-
Comments
All this while, I am not particularly keen on poultry companies as they are susceptible to certain external factors beyond their control (virus, raw material cost, price control by government, etc). However, different people has different view and mine might not necessarily be correct. Recently, the operating environment for the industrty has been quite favorable with feedmeal prices declining to low level. Many poultry companies had been reporting healthy profit.
==========================================================================================
Caely Holdings
Caely Holdings Bhd (CHB) Snapshot
Open
0.45
|
Previous Close
0.47
| |
Day High
0.46
|
Day Low
0.45
| |
52 Week High
04/7/14 - 0.59
|
52 Week Low
12/15/14 - 0.34
| |
Market Cap
36.4M
|
Average Volume 10 Days
74.0K
| |
EPS TTM
0.05
|
Shares Outstanding
80.0M
| |
EX-Date
09/25/14
|
P/E TM
8.9x
| |
Dividend
0.01
|
Dividend Yield
2.20%
|
Caely Holdings Bhd., an investment holding company, manufactures and sells undergarments in Malaysia under original equipment manufacturer arrangements, as well as under its own brand. It is also involved in the multi-level marketing of undergarments and household products. In addition, it is engaged in the property development and construction activities and operation of a golf course. The company exports its undergarments to Europe, Canada, the United States, and other Asian countries. Caely Holdings Bhd. is headquartered in Teluk Intan, Malaysia.
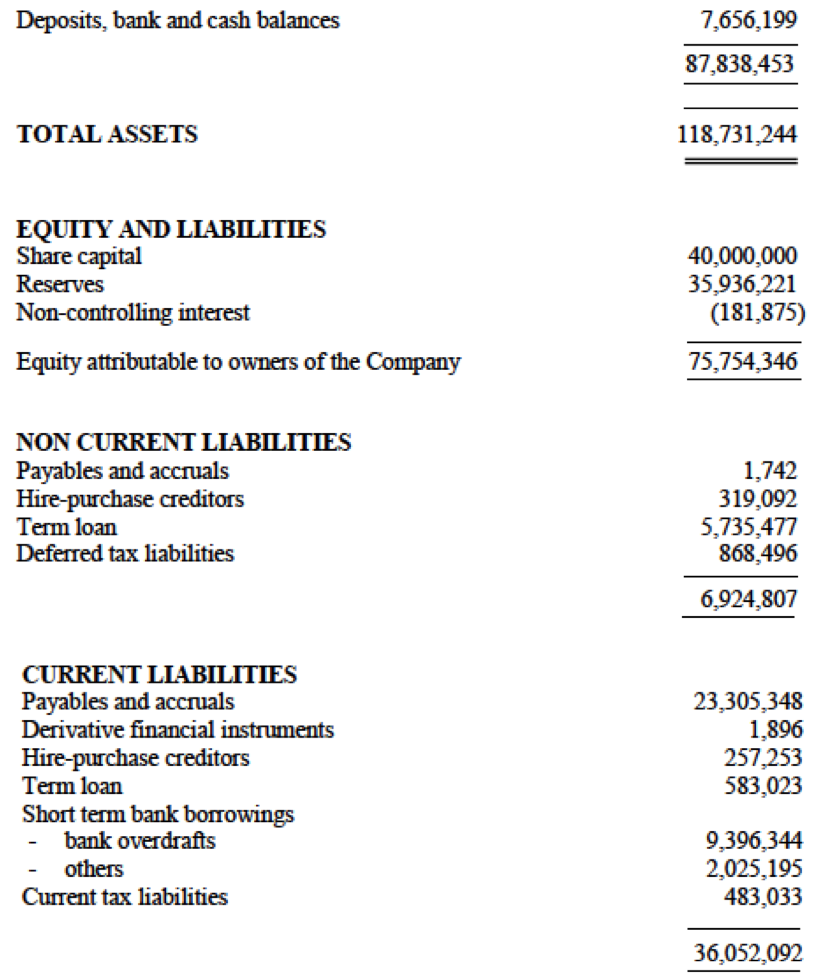
Strong balance sheets :-
Quarter Result:
| F.Y. | Quarter | Revenue ('000) | Profit before Tax ('000) | Profit Attb. to SH ('000) | EPS (Cent) | DPS (Cent) | NAPS |
|---|---|---|---|---|---|---|---|
| 2015-03-31 | 2014-09-30 | 22,218 | -69 | 116 | 0.10 | - | 0.9500 |
| 2015-03-31 | 2014-06-30 | 18,243 | 2,168 | 1,656 | 2.00 | - | 0.9500 |
| 2014-03-31 | 2014-03-31 | 19,960 | -1,474 | 864 | 1.20 | - | 0.9200 |
| 2014-03-31 | 2013-12-31 | 25,310 | 1,287 | 1,552 | 1.80 | - | 0.8900 |
| 2014-03-31 | 2013-09-30 | 26,129 | 2,189 | 2,143 | 2.60 | - | 0.8700 |
| 2014-03-31 | 2013-06-30 | 23,097 | 2,808 | 2,423 | 3.00 | - | 0.8400 |
| 2013-03-31 | 2013-03-31 | 23,557 | 797 | 652 | 0.80 | - | - |
| 2013-03-31 | 2012-12-31 | 24,114 | 563 | 356 | 0.40 | - | 0.8100 |
| 2013-03-31 | 2012-09-30 | 22,729 | 576 | 426 | 0.50 | - | 0.8000 |
| 2013-03-31 | 2012-06-30 | 21,122 | 190 | 247 | 0.30 | - | 0.8000 |
| 2012-03-31 | 2012-03-31 | 26,109 | 5,377 | 3,097 | 3.90 | - | - |
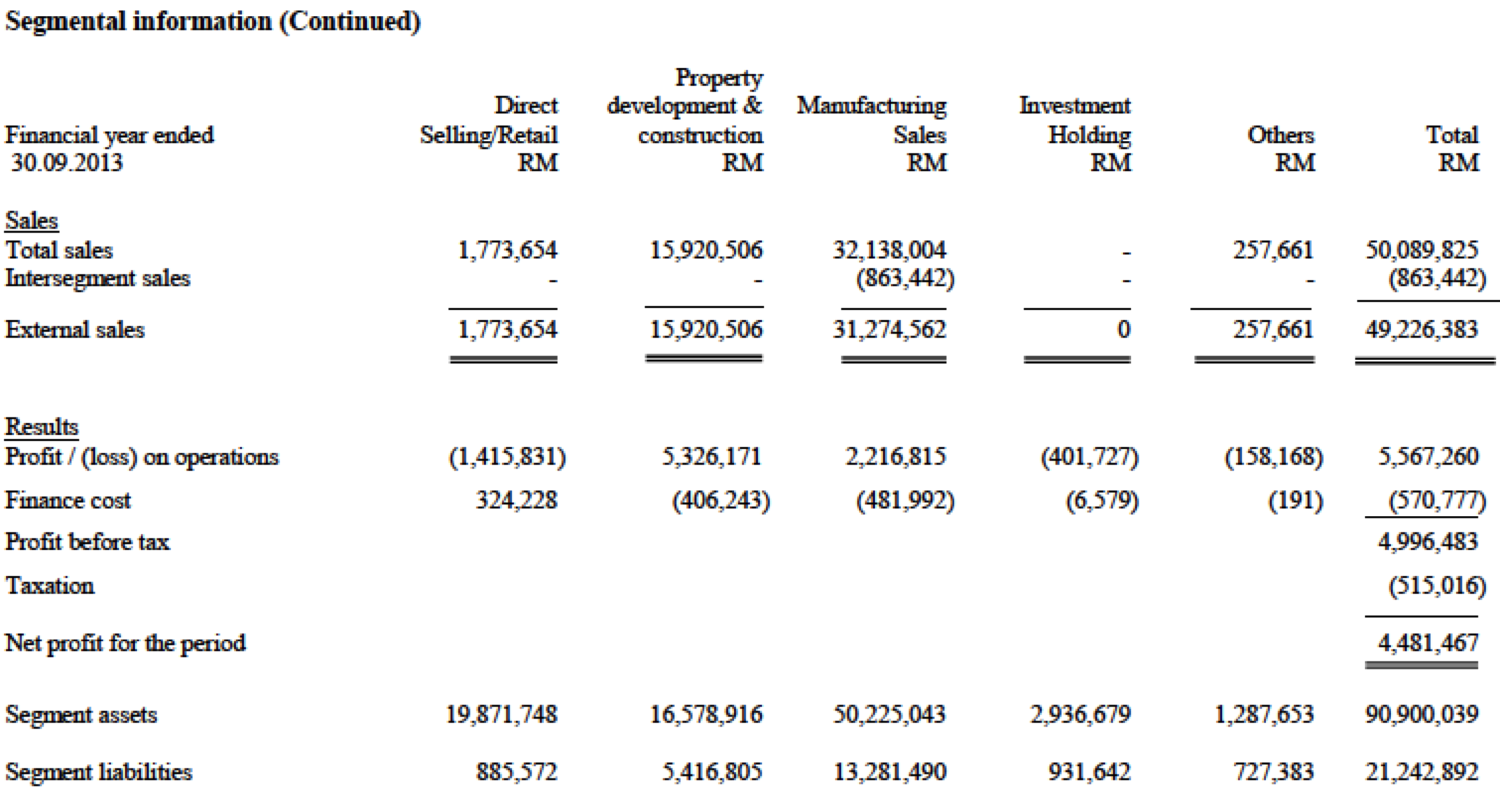
As shown in table above, for the 6 months ended September 2014 (Caely has March financial year end), property development contributed the most PBT at RM4.8 mil while the lingerie business collectively contributed RM0.1 mil only.
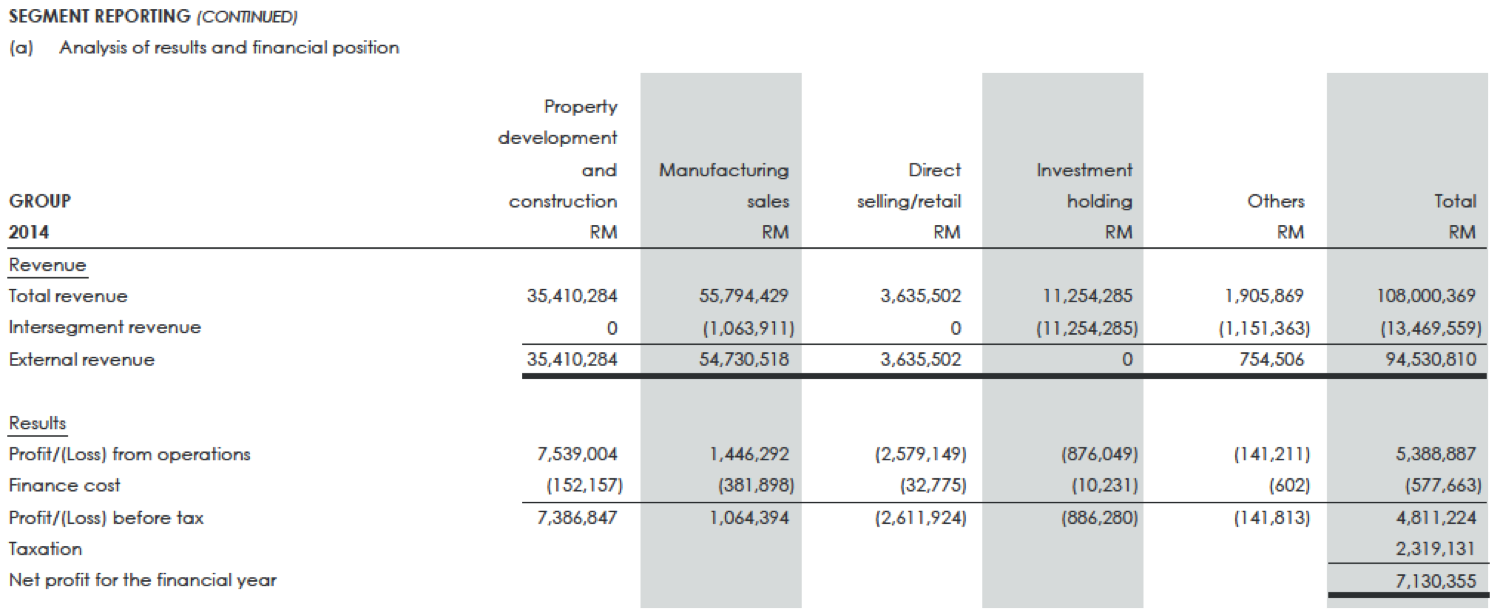
In financial year ended 31 March 2014, property development contributed PBT of RM7.5 mil while lingerie business reported loss before tax of RM2.5 mil.
Sales by geopgraphical locations :-
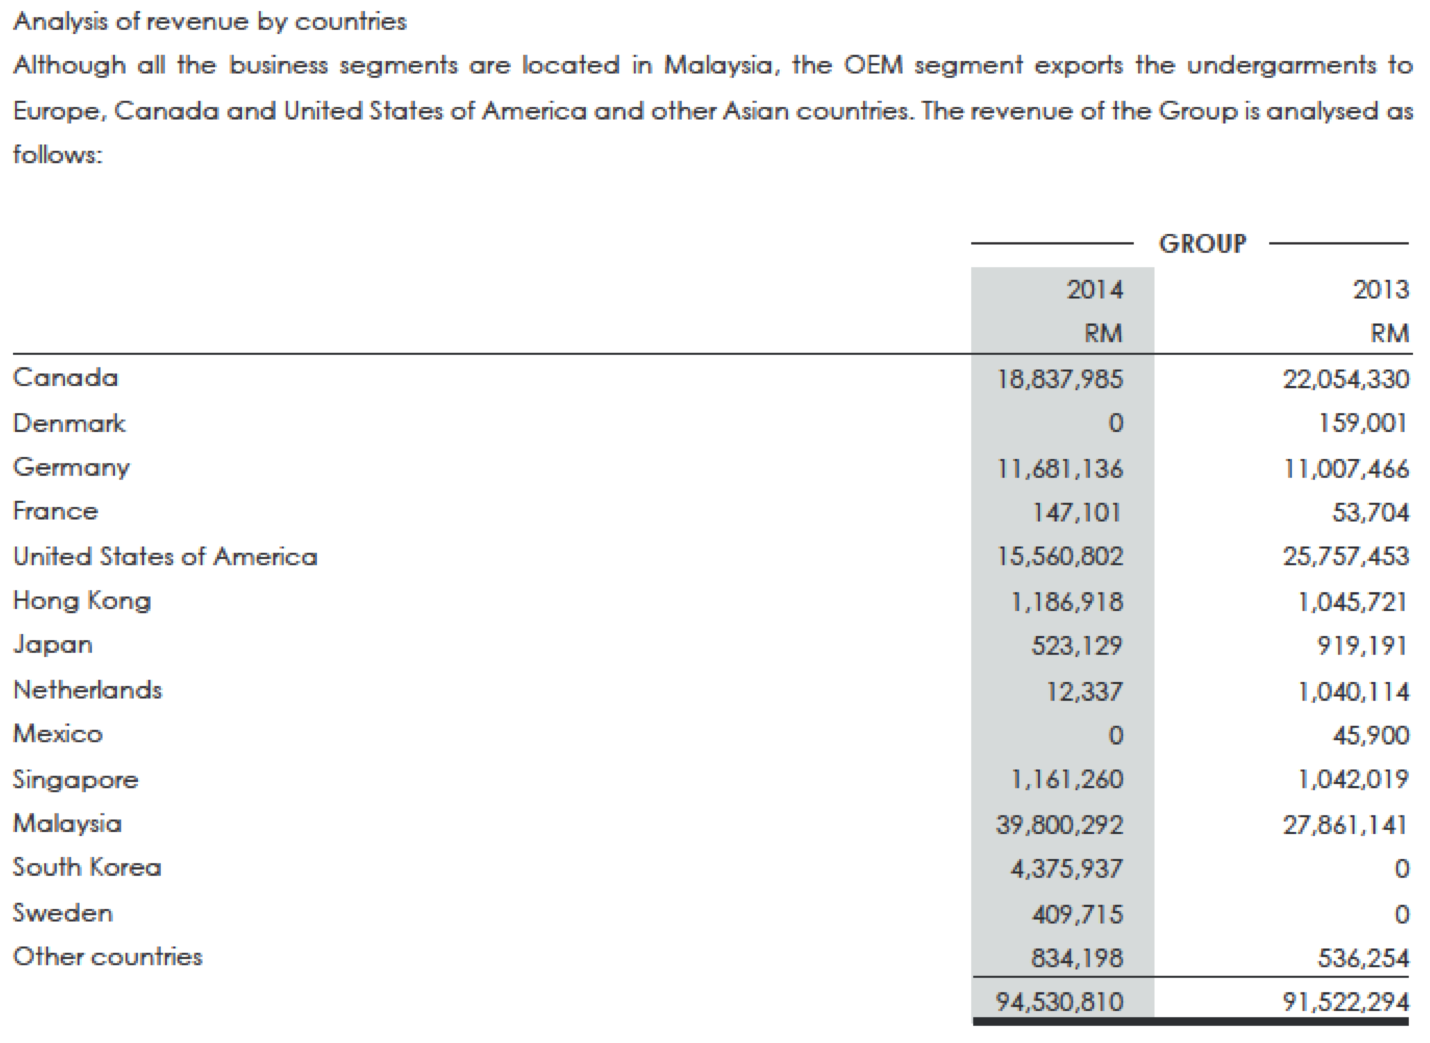
In FY2014, RM39 mil of the group's sales are for Malaysian customers. However, this is likely related to the property development business, which accounted for RM35 mil revenue in FY2014. As such, out of RM56 mil of its lingerie business revenue, only RM4 mil is sales in Malaysia while RM52 mil, representing 96% of lingerie sales, are to customers overseas.
In short, the group exports almost all its lingerie products.
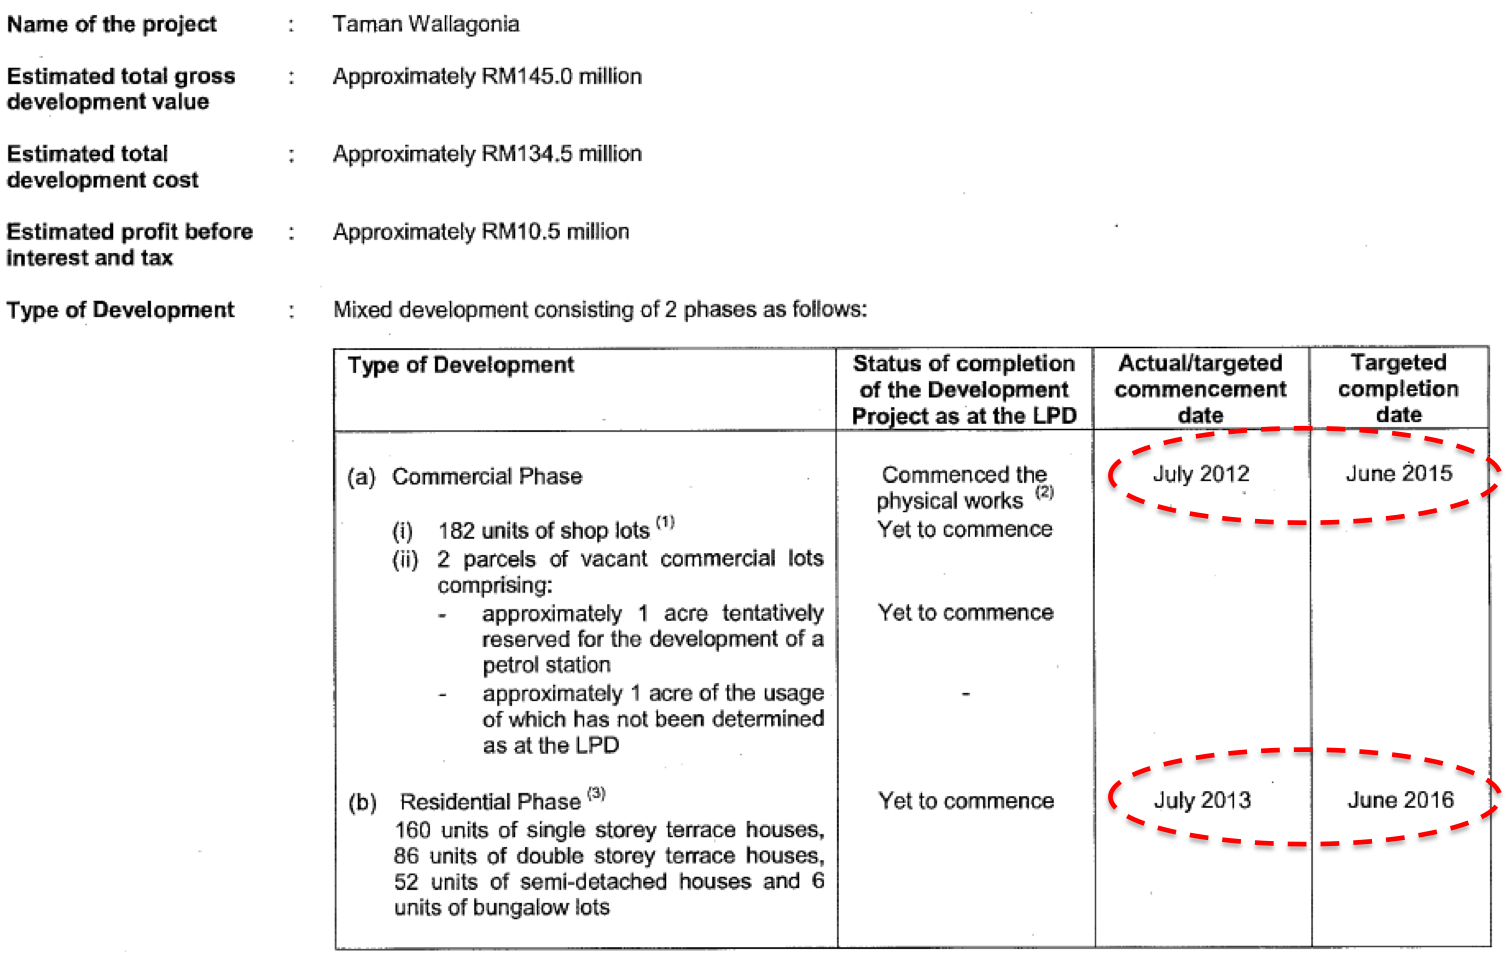
Now that we have found out that Caely derived most of its earnings from property development, we should find out more about this division.
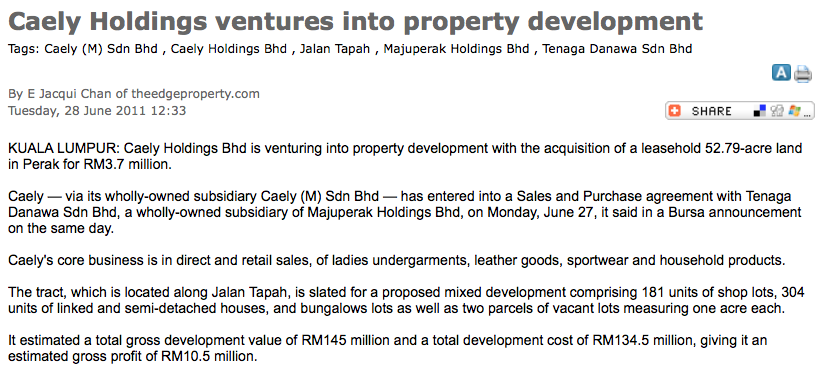
According to the Company's circular dated January 2013, the project is targeted for completion by June 2016.
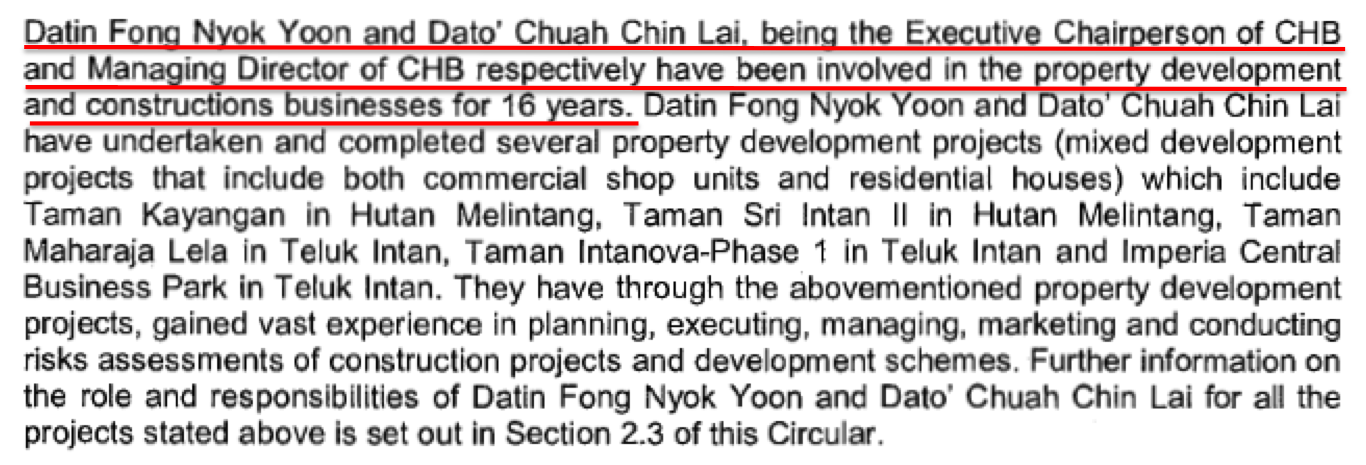
Caely's major shareholders Datin Fong and Dato' Chuah has 16 years experience in property development. This explained why the group managed to turn in substantial profit from property development within such a short span of time (diversified into property development in January 2013 and reported RM5 mil PBT in FYE March 2014).
On 4 December 2013, the company announced that it has secured a RM97 mil construction contract from Felcra. The contract is target to be completed within 24 months (by end 2015).
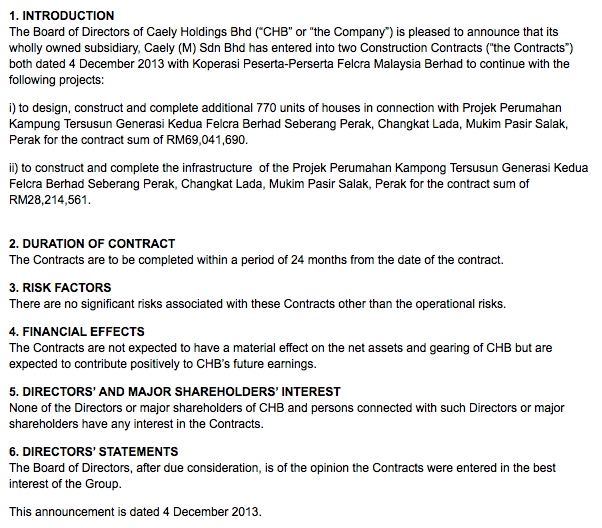
This was not the first construction contract. Earlier on in September 2012, Caely announced that it has secured a construction contract from Felcra.
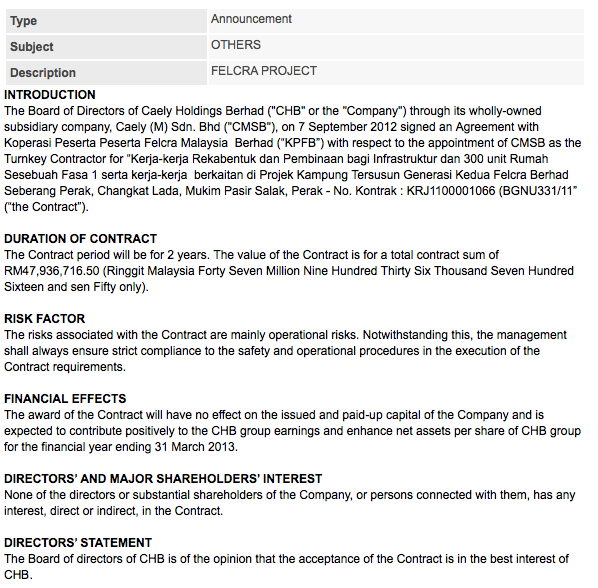
It seemed that Caely has a closed / friendly relationship with Felcra. The relationship was propbably built up over the years through their geographical proximity. Caely is based in Teluk Intan, Perak while Felcra has a hot spring resort operation in Tapah, Perak.
In July 2013, Caely announced that it has entered into a JV for condominium project in Gombak, Selangor. It seemed that this project will play an important role in the group's earning over the next few years.
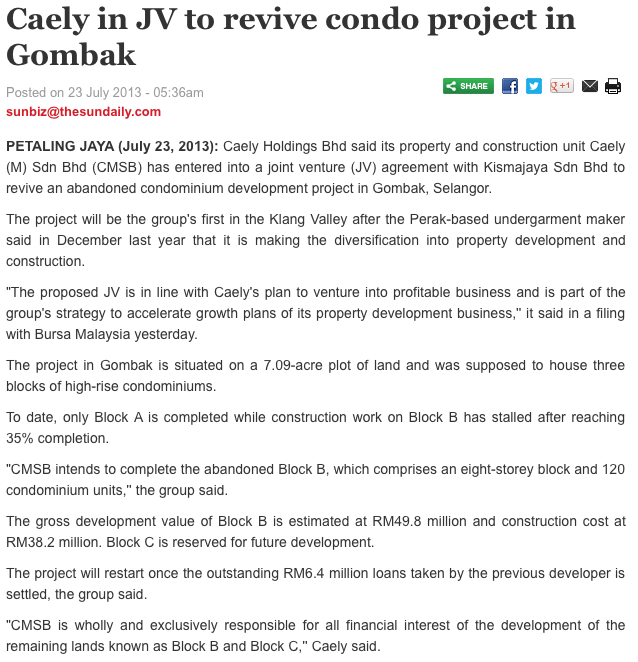
However, the group does not have a lot of landbanks. According to annual report, the only development lanbank they have is the land at Batang Padang, Tapah, which the company bought in 2011.
Comments
(a) Export oriented, will benefit from weak Ringgit.
(b) Property development is the main contributor to earnings. The company is new to this business but the management team has more than 16 years experience (in their private capacity).
(c) Despite recent slow down in property industry, I am of the view that the group's involvment in property development is a plus point. Property development is highly scalable. With tiny market cap at RM36 mil, the group has potential for immense growth.
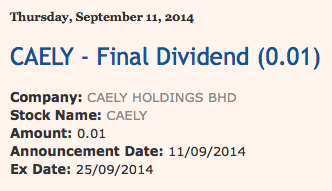
(d) The company declared 1 sen dividend in FY2014. Based on current market price, dividend yield is 2.2%.
==========================================================================================
Cam Resources
Cam Resources Bhd (CAM) Snapshot
Open
0.32
|
Previous Close
0.32
| |
Day High
0.33
|
Day Low
0.32
| |
52 Week High
09/9/14 - 0.37
|
52 Week Low
03/3/14 - 0.21
| |
Market Cap
55.8M
|
Average Volume 10 Days
197.4K
| |
EPS TTM
0.03
|
Shares Outstanding
174.3M
| |
EX-Date
04/25/11
|
P/E TM
11.2x
| |
Dividend
--
|
Dividend Yield
--
|
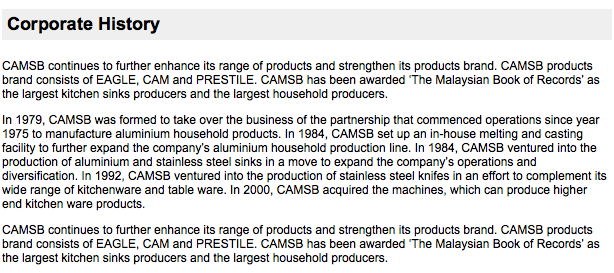
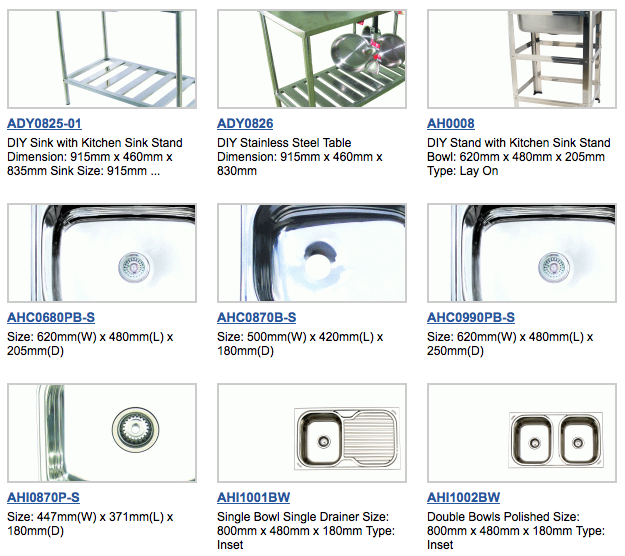
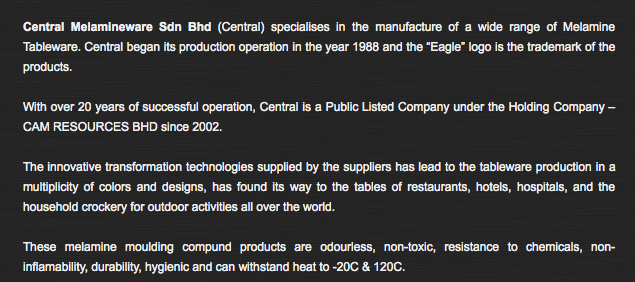
CAM Resources Berhad, an investment holding company, manufactures, sells, distributes, and trades in aluminum and stainless steel household products in Malaysia and other Asian countries, the Middle East and Africa, and North America. The company offers aluminum and stainless steel kitchen ware, sinks, and melamine table ware products. It also trades in household products; and produces and sells crude palm oil, palm kernel, and other related products, as well as palm fiber. The company was incorporated in 2000 and is based in Hutan Melintang, Malaysia.
From the company's name CAM ("Central Aluminium Manufactory"), one can tell that the group is related to products manufacturing by using Aluminium.

Quarter Result:
| F.Y. | Quarter | Revenue ('000) | Profit before Tax ('000) | Profit Attb. to SH ('000) | EPS (Cent) | DPS (Cent) | NAPS |
|---|---|---|---|---|---|---|---|
| 2014-12-31 | 2014-09-30 | 57,195 | 2,614 | 2,136 | 1.21 | - | 0.5500 |
| 2014-12-31 | 2014-06-30 | 63,401 | 2,032 | 1,149 | 0.65 | - | 0.5400 |
| 2014-12-31 | 2014-03-31 | 51,642 | 647 | 358 | 0.20 | - | 0.5300 |
| 2013-12-31 | 2013-12-31 | 47,249 | 1,364 | 1,408 | 0.79 | - | 0.5300 |
| 2013-12-31 | 2013-09-30 | 40,625 | 981 | 370 | 0.21 | - | 0.5200 |
| 2013-12-31 | 2013-06-30 | 36,139 | 369 | 157 | 0.09 | - | 0.5200 |
| 2013-12-31 | 2013-03-31 | 35,560 | 492 | 283 | 0.16 | - | 0.5200 |
| 2012-12-31 | 2012-12-31 | 30,387 | -34 | 106 | 0.21 | - | - |
| 2012-12-31 | 2012-09-30 | 40,179 | 472 | 307 | 0.17 | - | 0.5200 |
| 2012-12-31 | 2012-06-30 | 34,826 | 598 | 360 | 0.20 | - | 0.5100 |
| 2012-12-31 | 2012-03-31 | 18,582 | 821 | 324 | 0.28 | - | 0.5100 |
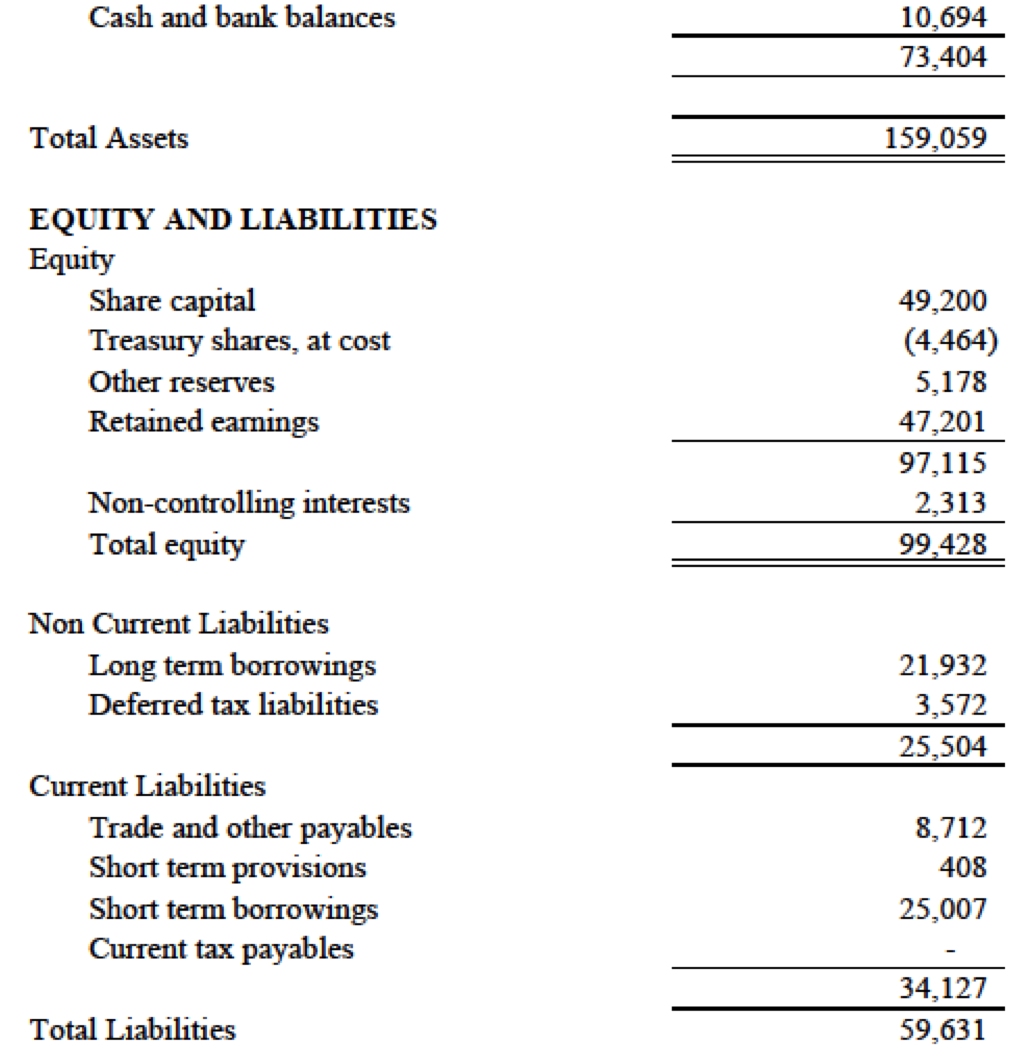
Reasonably healthy balance sheets :-
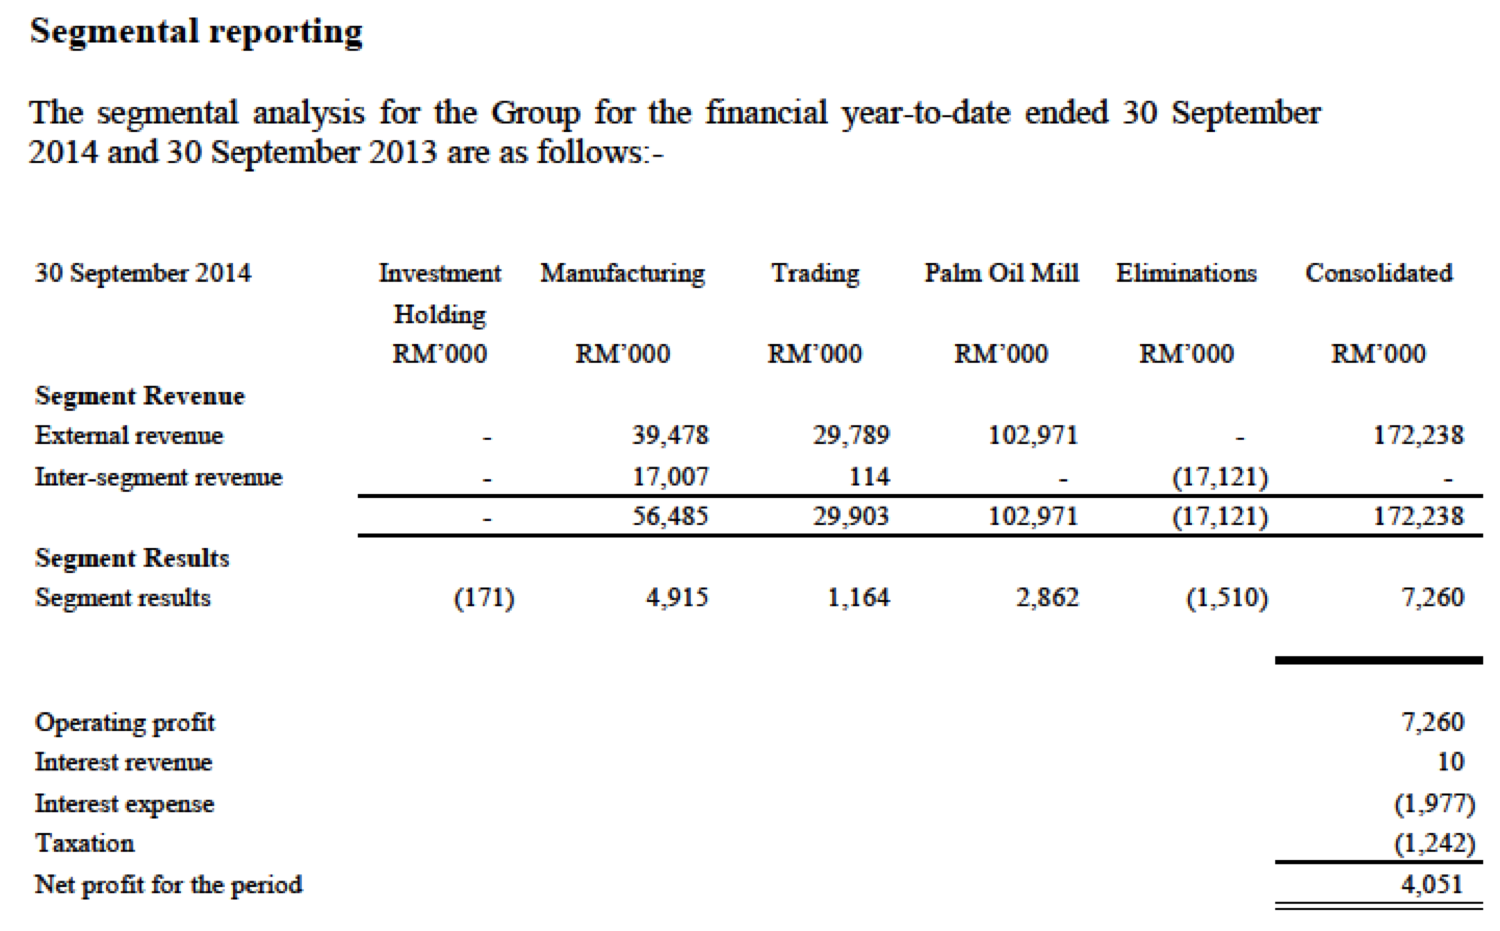
The group's manufacturing division reported stronger operating profit of RM4.9 mil for teh first 9 months of FY2014, vs RM2.5 mil in same period last year. Palm oil mail division also reported stronger earnings of RM2.86 mil vs RM0.4 mil last year.
All the group's sale are in Malaysia.

CAM ventured into palm oil milling through acquisition of 84% equity interest in Central Palm Oil Mill Sdn Bhd in 2011 and 2012 respectively :-

As at January 2015, the company is in the process of acquiring the remaining 16% of CPOM for cash consideration of RM7.2 mil.
Since acquisition, CPOM has started to make positive contribution to the group. For the 9 months ended September 2014, CPOM contributed RM2.86 mil operating profit to the group, this represents almost 60% of the manufacturing division's operating profit. CPOM has just completed a 60% capacity expansion. As such, it is expected to increase earnings contibution in the future.
Comments
(a) The group had done well in recent few quarters. Increase in earnings contribution from palm oil milling is one of the reasons. However, these is not sufficient information to determine the reason behind manufacturing division's better profitability.
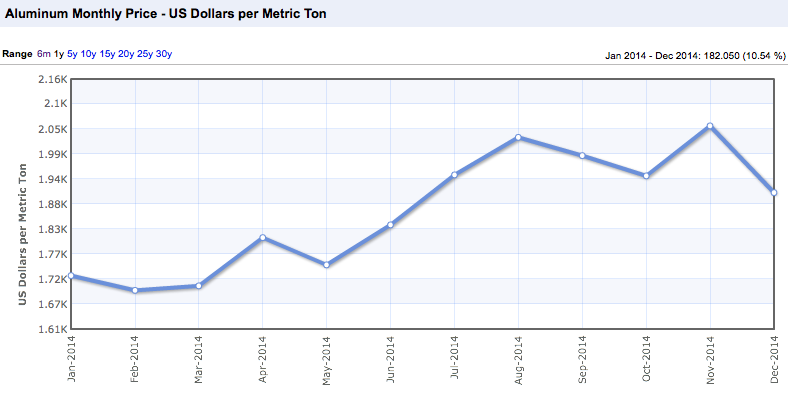
(Aluminium price remained strong)
(b) Going forward, earnings is likely to get a boast from palm oil milliing as it just completed capacity expansion by 60%.
(c) At current price, the stock looked fairly valued.
No comments:
Post a Comment