The Next Latitude Tree ?
Author: Icon8888 | Publish date: Thu, 26 Feb 2015, 11:02 AM
Executive Summary
(a) First of all, Len Cheong is unlikely to become the next Latitude. I am just using the title to attract eyeballs and to humour readers.
The contrast could not be bigger. Latitude has market cap of RM564 mil while Len Cheong's market cap is only RM14 mil (which makes it unique as there are not many non PN17 companies with such tiny market cap).
Latitude reported revenue of RM651 mil in latest fainancial year while Len Cheong's revenue was only RM26 mil.
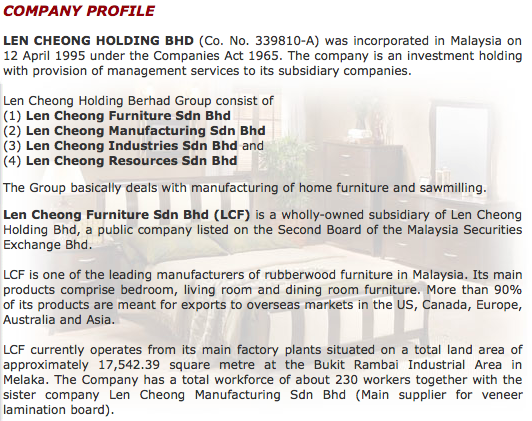
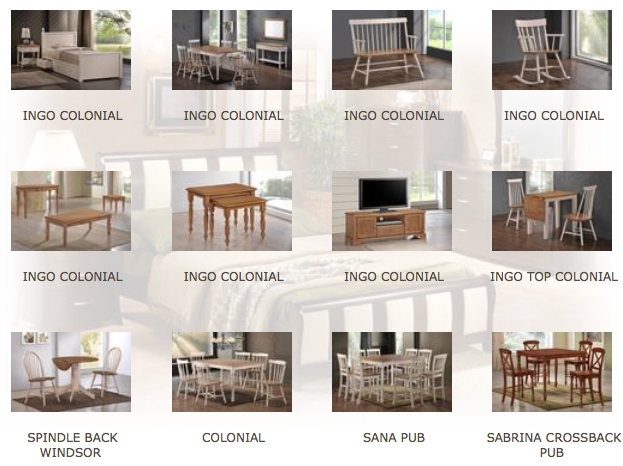
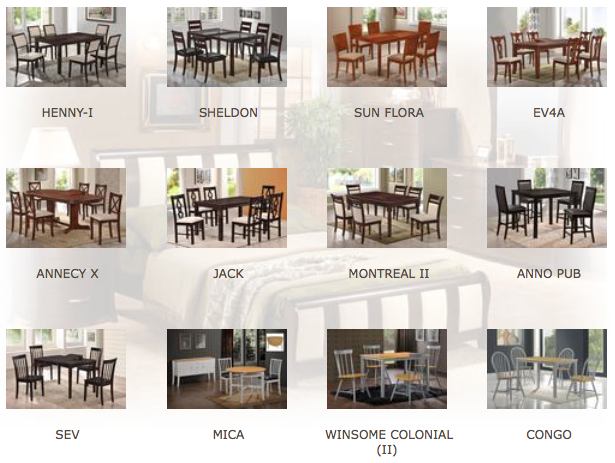
The only thing they have in common is that both manufacture furniture by using rubberwood.
(b) The reason I decided to write about Len Cheong is because yesterday there was a huge spike in trading volume. Usually fewer than 100,000 shares were traded daily but yesterday more than 2 mil shares changed hand.
After covering so many stocks with good fundamentals, I decided to venture out of my comfort zone to try something a bit speculative.
After all, tomorrow will be the last day to release December 2014 quarterly report. With about 50% of its products exported, will Len Cheong spring a surprise ?
Len Cheong Holdings Berhad (LEN) Snapshot
Open
0.21
|
Previous Close
0.22
| |
Day High
0.21
|
Day Low
0.21
| |
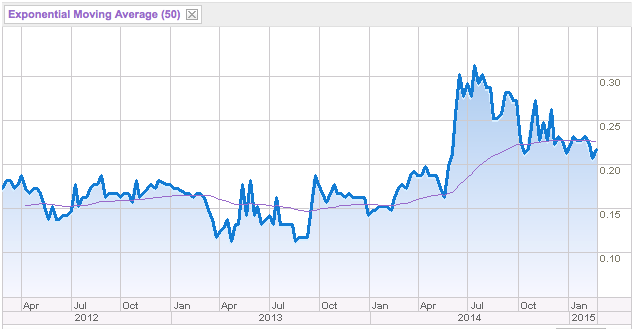
52 Week High
07/17/14 - 0.33
|
52 Week Low
02/27/14 - 0.14
| |
Market Cap
13.9M
|
Average Volume 10 Days
636.7K
| |
EPS TTM
-0.06
|
Shares Outstanding
66.0M
| |
EX-Date
07/2/99
|
P/E TM
--
| |
Dividend
--
|
Dividend Yield
--
|


The group has strong balance sheets. With net assets of RM34 mil, cash of RM0.1 mil and loans of RM0.7 mil, net gearing is approximately 1% only. This is very important. All these years, the group has reported mediocre profitability. Without generating surpluses, the group will not be able to survive long term if there is heavy gearing.

As shown in table below, the group has not been very profitable throughout the years. With many other furniture companies doing so well in recent years, Len Cheong's lackluster performance reflects management team and major shareholder's complacency and lack of ambitions and dynamism.
Annual Result:
| F.Y. | Revenue ('000) | Profit Attb. to SH ('000) | EPS (Cent) | PE | DPS (Cent) | DY | NAPS | ROE (%) |
|---|---|---|---|---|---|---|---|---|
| TTM | 25,293 | 14,184 | 23.64 | 0.89 | 0.00 | - | 0.5700 | 41.47 |
| 2013-12-31 | 25,823 | -1,260 | -2.10 | - | - | - | 0.3300 | - |
| 2012-12-31 | 25,467 | -453 | -0.76 | - | - | - | 0.3500 | - |
| 2011-12-31 | 22,018 | 113 | 0.19 | 94.74 | - | - | 0.3600 | 0.53 |
| 2010-12-31 | 24,993 | 287 | 0.48 | 25.00 | - | - | 0.3500 | 1.37 |
| 2009-12-31 | 24,140 | 148 | 0.25 | 56.00 | - | - | 0.3500 | 0.71 |
| 2008-12-31 | 37,756 | 1,005 | 1.68 | 8.34 | - | - | 0.3500 | 4.80 |
Quarter Result:
| F.Y. | Quarter | Revenue ('000) | Profit before Tax ('000) | Profit Attb. to SH ('000) | EPS (Cent) | DPS (Cent) | NAPS |
|---|---|---|---|---|---|---|---|
| 2014-12-31 | 2014-09-30 | 5,843 | -3,460 | -3,460 | -5.77 | - | 0.5700 |
| 2014-12-31 | 2014-06-30 | 6,135 | 54 | 54 | 0.09 | - | 0.6300 |
| 2014-12-31 | 2014-03-31 | 4,969 | 232 | 18,204 | 30.34 | - | 0.6300 |
| 2013-12-31 | 2013-12-31 | 8,346 | -614 | -614 | -1.02 | - | 0.3300 |
| 2013-12-31 | 2013-09-30 | 6,167 | -519 | -519 | -0.87 | - | 0.3400 |
| 2013-12-31 | 2013-06-30 | 6,148 | -76 | -76 | -0.13 | - | 0.3500 |
| 2013-12-31 | 2013-03-31 | 5,162 | -51 | -51 | -0.09 | - | 0.3500 |
| 2012-12-31 | 2012-12-31 | 6,571 | -539 | -539 | -0.90 | - | - |
| 2012-12-31 | 2012-09-30 | 7,657 | 2 | 2 | - | - | 0.3600 |
| 2012-12-31 | 2012-06-30 | 5,428 | 31 | 31 | 0.05 | - | 0.3600 |
| 2012-12-31 | 2012-03-31 | 5,811 | 53 | 53 | 0.09 | - | 0.3600 |
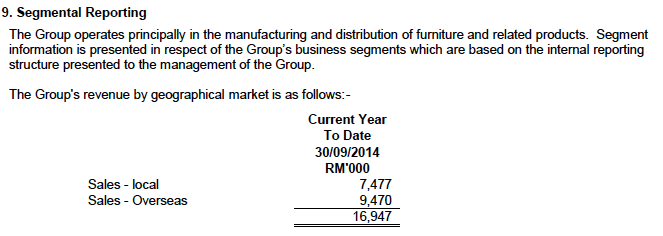
The group derives approximately 56% of its sales from overseas :-
According to the company, the September 2014 quarterly loss of RM3.5 mil was mostly due to writing off of certain obsolete stocks.

No comments:
Post a Comment