Steady and Old Fashioned
Author: Icon8888 | Publish date: Sun, 22 Mar 2015, 01:47 PMPie Industrial Bhd (PIE) Snapshot
Open
6.77
|
Previous Close
6.73
| |
Day High
7.00
|
Day Low
6.77
| |
52 Week High
06/10/14 - 7.75
|
52 Week Low
12/16/14 - 5.20
| |
Market Cap
537.7M
|
Average Volume 10 Days
3.2K
| |
EPS TTM
0.51
|
Shares Outstanding
76.8M
| |
EX-Date
05/27/14
|
P/E TM
13.6x
| |
Dividend
0.10
|
Dividend Yield
2.43%
|
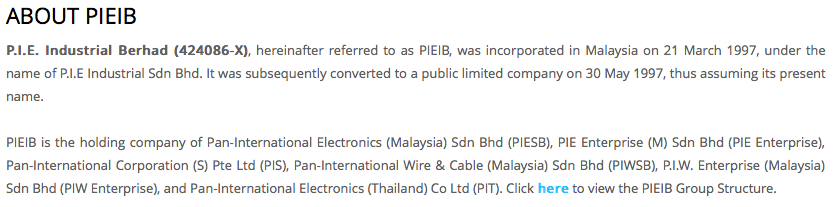
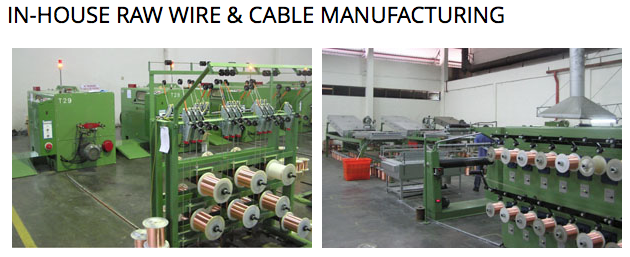
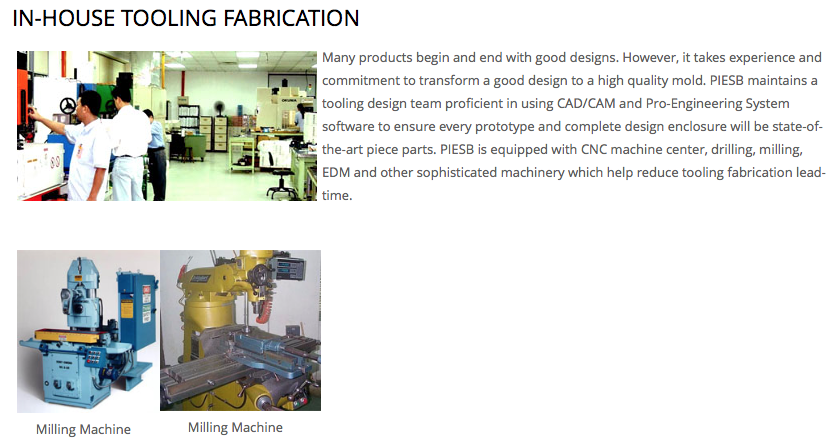
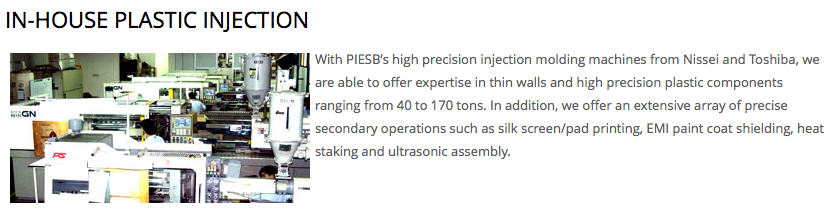
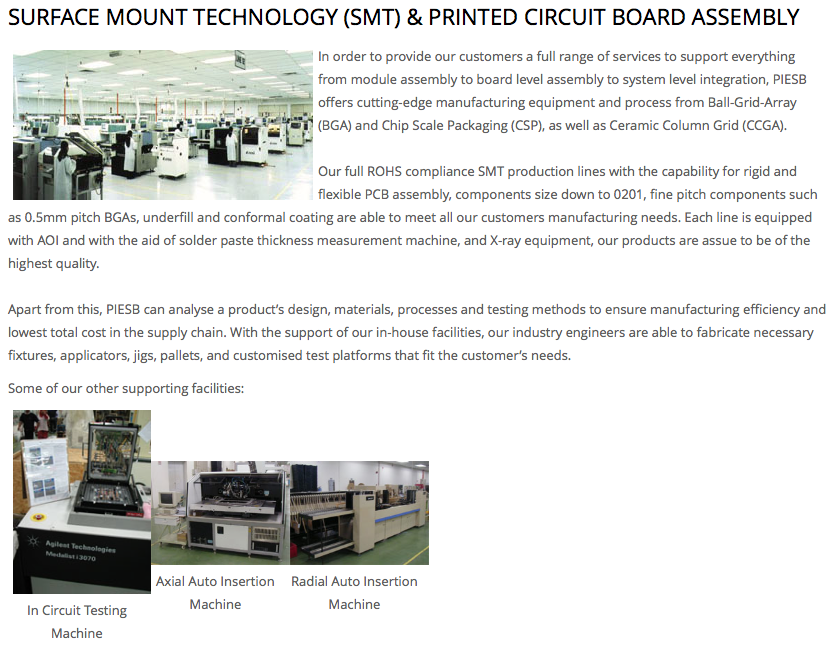
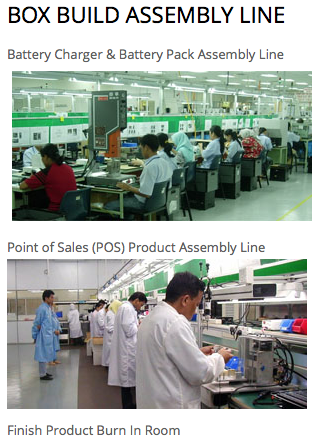
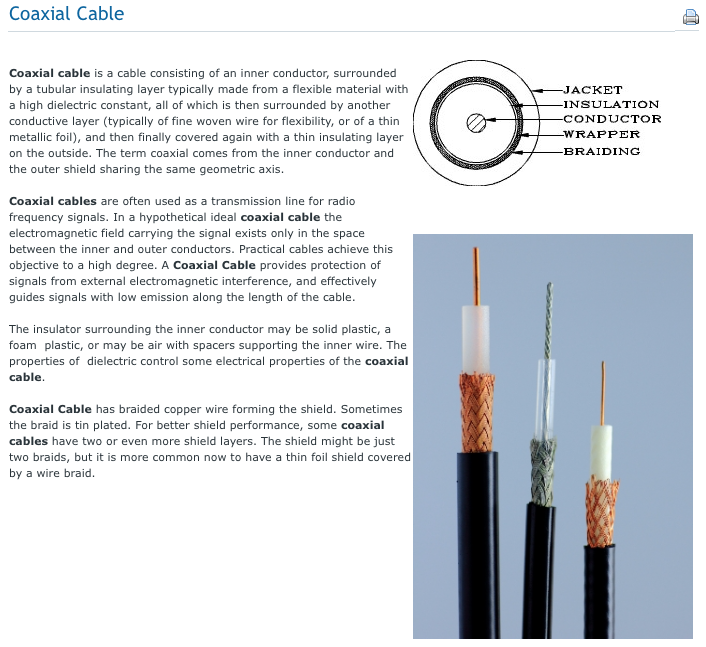
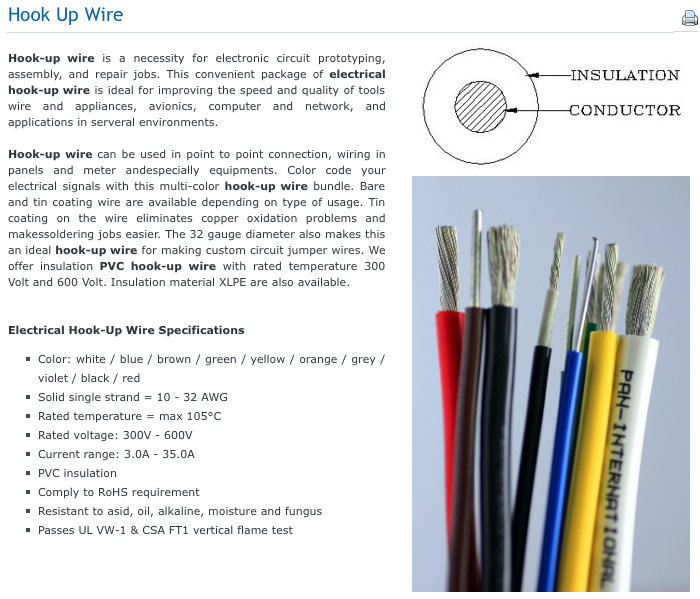
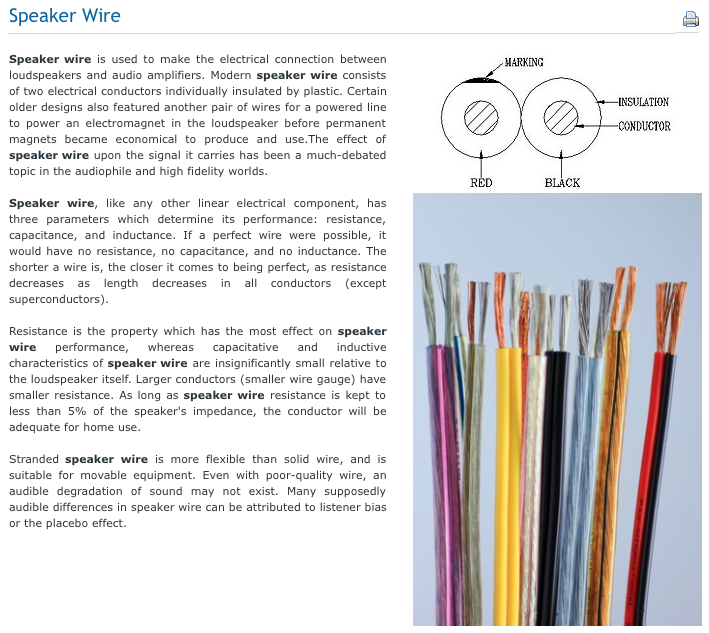
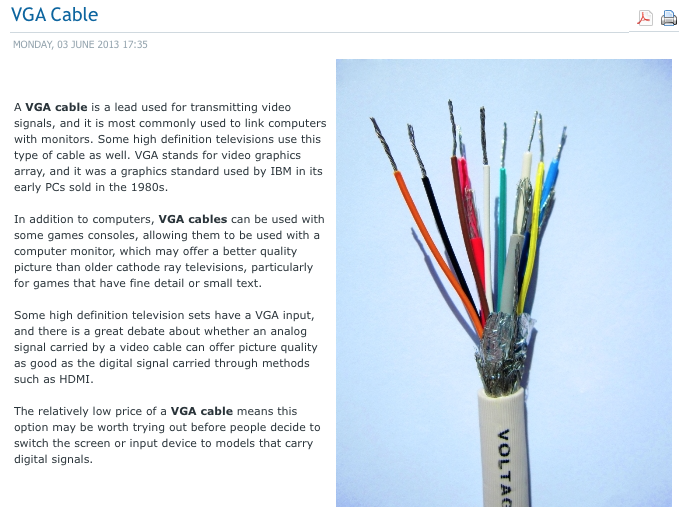
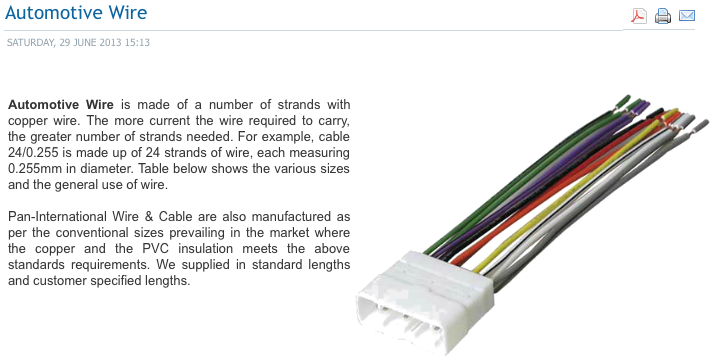
P.I.E. Industrial Berhad is engaged in the manufacture and assembly of cables and wiresfor various industries, PCB assemblies and contract manufacturing of barcode readers, etc.
The company was incorporated in 1997 and is based in Seberang Perai, Malaysia.
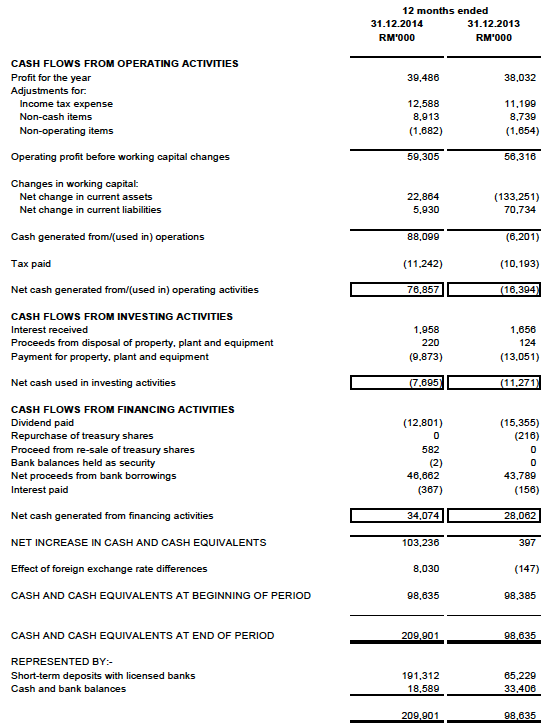
The group has strong balance sheets. It has cash and loans of RM210 mil and RM95 mil respectively. Net cash per share is RM115 mil / 76.8 = RM1.50.
Cash flow statement as follows :-
For a technology company, the group's performance has been surprisingly consistent and resilient. Even during 2008 and 2009, earnings only dropped by approximately 20%.
Annual Result:
| F.Y. | Revenue ('000) | Profit Attb. to SH ('000) | EPS (Cent) | PE | DPS (Cent) | DY | NAPS | ROE (%) |
|---|---|---|---|---|---|---|---|---|
| TTM | 561,710 | 39,486 | 51.43 | 13.62 | 20.00 | 2.86 | 4.1500 | 12.39 |
| 2014-12-31 | 561,710 | 39,486 | 51.43 | 11.44 | 20.00 | 3.40 | 4.1500 | 12.39 |
| 2013-12-31 | 449,027 | 38,032 | 49.55 | 14.05 | 32.00 | 4.60 | 4.5000 | 11.01 |
| 2012-12-31 | 348,816 | 34,349 | 53.69 | 8.05 | 39.00 | 9.03 | 4.1500 | 12.94 |
| 2011-12-31 | 349,650 | 37,227 | 58.19 | 6.74 | 35.00 | 8.93 | 3.8900 | 14.96 |
| 2010-12-31 | 287,203 | 25,663 | 40.10 | 9.86 | 35.00 | 8.86 | 3.6500 | 10.99 |
| 2009-12-31 | 225,902 | 25,282 | 39.51 | 10.64 | 35.00 | 8.33 | 3.4800 | 11.35 |
| 2008-12-31 | 291,784 | 33,936 | 53.02 | 7.13 | 36.00 | 9.52 | 3.3100 | 16.02 |
| 2007-12-31 | 280,949 | 35,591 | 56.84 | 10.47 | 26.00 | 4.37 | 3.0600 | 18.58 |
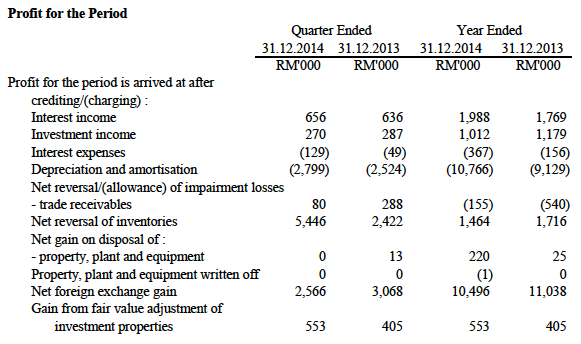
The group reported a huge jump in earnings in December 2014 quarter to RM14.2 mil. The spike in earnings was due to forex gain and net reversal of inventories of RM2.6 mil and RM5.5 mil respectively.
As a matter of fact, out of FY2014 net profit of RM39.5 mil, RM10.5 mil was due to forex gain (please refer to table below).
Excluding the forex gain, full year net profit would be RM29 mil. EPS would be 37.8 sen. Based on RM6.73, PER would be 17.8 times.
Quarter Result:
| F.Y. | Quarter | Revenue ('000) | Profit before Tax ('000) | Profit Attb. to SH ('000) | EPS (Cent) | DPS (Cent) | NAPS |
|---|---|---|---|---|---|---|---|
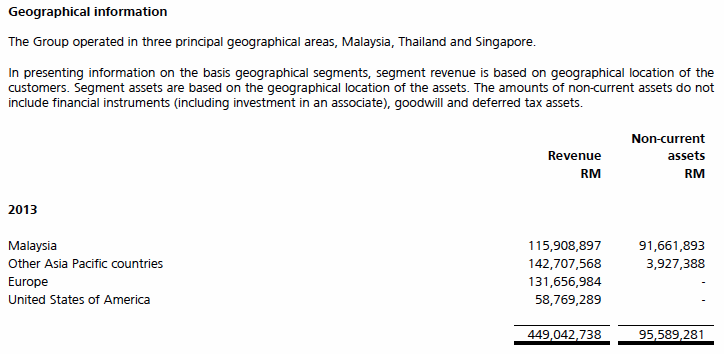
| 2014-12-31 | 2014-12-31 | 157,687 | 19,639 | 14,179 | 18.46 | - | 4.1500 |
| 2014-12-31 | 2014-09-30 | 131,428 | 10,532 | 8,286 | 10.79 | - | 3.9300 |
| 2014-12-31 | 2014-06-30 | 115,228 | 10,038 | 7,902 | 10.29 | 20.00 | 3.8100 |
| 2014-12-31 | 2014-03-31 | 157,367 | 11,866 | 9,119 | 14.26 | - | 4.6500 |
| 2013-12-31 | 2013-12-31 | 142,711 | 15,671 | 12,462 | 16.24 | - | - |
| 2013-12-31 | 2013-09-30 | 116,394 | 13,315 | 10,483 | 16.39 | - | 4.3400 |
| 2013-12-31 | 2013-06-30 | 108,332 | 13,228 | 9,551 | 14.93 | 32.00 | 4.1600 |
| 2013-12-31 | 2013-03-31 | 81,590 | 7,016 | 5,535 | 8.65 | - | 4.2800 |
| 2012-12-31 | 2012-12-31 | 92,663 | 17,532 | 13,710 | 21.43 | - | - |
| 2012-12-31 | 2012-09-30 | 84,740 | 8,351 | 6,473 | 10.12 | - | 4.0200 |
| 2012-12-31 | 2012-06-30 | 91,386 | 11,144 | 8,277 | 12.94 | 39.00 | 3.9300 |
| 2012-12-31 | 2012-03-31 | 80,026 | 7,187 | 5,889 | 9.20 | - | 4.0800 |
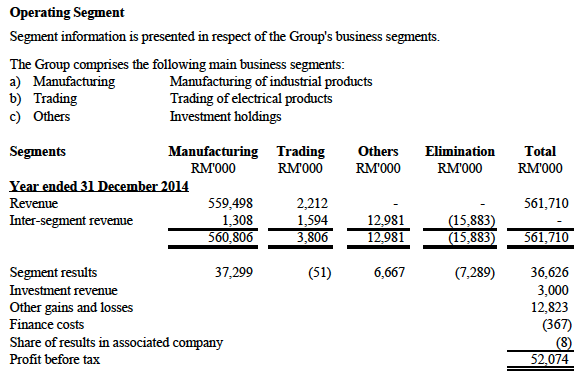
The group exports the bulk of its products and hence is a beneficiary of weak Ringgit.
Appendix - The PIE Industrial Group

No comments:
Post a Comment