Author: Icon8888 | Publish date: Wed, 8 Jul 2015, 01:40 PM
1. Introduction
A moat is a deep, broad ditch that surrounds a castle. It defenses against invaders.

When come to stock picking, companies that have "moat" are those that have competitive advantages that differentiate them from rivals. Companies with "moat" usually will do well.
Instead of relying on subjective evaluation, several famous investors have used Return On Invested Capital to identify companies with "moat".
There are different formulas used, but one used by Joel Greenblatt is as follows :-
ROIC = EBIT / Invested Capital,
whereby
Invested Capital = Property Plant & Equipment + Current Assets - Excess Cash - Non Interest Bearing Current Liabilities
To be honest, this concept is new to me. I learn about it from articles written by a respected blogger. But it is love at first sight and I embrace it wholeheartedly. Even though I still rely on PE Ratio as principal stock picking tool, it has become a habit for me to cross check with this ratio to determine the quality of the company's earnings.
One thing that attracted me to Imaspro is its strong ROIC.
I have compiled an ROIC table to rank the various companies in my stock universe. However, I am thinking of writing a separate article on "moat" and ROIC. As such, I will reserve the bulk of the info for that article while showing few examples here to illustrate Imaspro's strong performance.
| Imaspro | Johotin | Tguan | |
| period | June 2014 | Dec 2014 | Dec 2014 |
| PBT | 11.3 | 17.7 | 18.8 |
| except Itm | (0.9) | (11.0) | (9.5) |
| int exp | 0.0 | (1.4) | (1.3) |
| EBIT | 12.2 | 30.1 | 29.6 |
| PPE | 23.9 | 83.8 | 135.9 |
| Current assets | 58.8 | 202.2 | 314.4 |
| surplus cash # | (33.3) | (0.0) | (70.3) |
| Trade payables ^ | (5.2) | (66.0) | (92.2) |
| Invested cap | 44.2 | 220.1 | 287.8 |
| EBIT / IC (%) | 27.5 | 13.7 | 10.3 |
# not required to fund core business operation
^ not part of invested capital as it is capital provided by suppliers free of charge
I made a quick comparison with Johotin and Thong Guan, two companies that I am relatively familiar with. Imaspro has ROIC of 27.5%, significantly higher than Johotin and Thong Guan (which are reasonably good companies).
To cut a long story short, Imaspro can generate strong profitability by using a small amount of assets. Only companies with competitive advantages can do that. According to theory by investment gurus, these type of companies will generate above average return over long term (of course, subject to reasonable entry cost).
2. Background Information
Imaspro Corp Bhd (IMAS) Snapshot
Open
1.45
|
Previous Close
1.43
| |
Day High
1.45
|
Day Low
1.41
| |
52 Week High
03/25/15 - 1.95
|
52 Week Low
01/22/15 - 1.17
| |
Market Cap
112.8M
|
Average Volume 10 Days
24.5K
| |
EPS TTM
0.13
|
Shares Outstanding
80.0M
| |
EX-Date
01/7/15
|
P/E TM
11.2x
| |
Dividend
0.04
|
Dividend Yield
2.48%
|
Imaspro Corporation Berhad is involved in manufacturing and trading of pesticides, hericides, fungicides, plant micronutrients, fertilizers and other agrochemicals.
50% of its sales are in Malaysia. The rest overseas - Indonesia, Bulgaria, Belgium, Vietnam, Australia, and Lebanon.
The company was incorporated in 2004 and is headquartered in Klang, Malaysia.
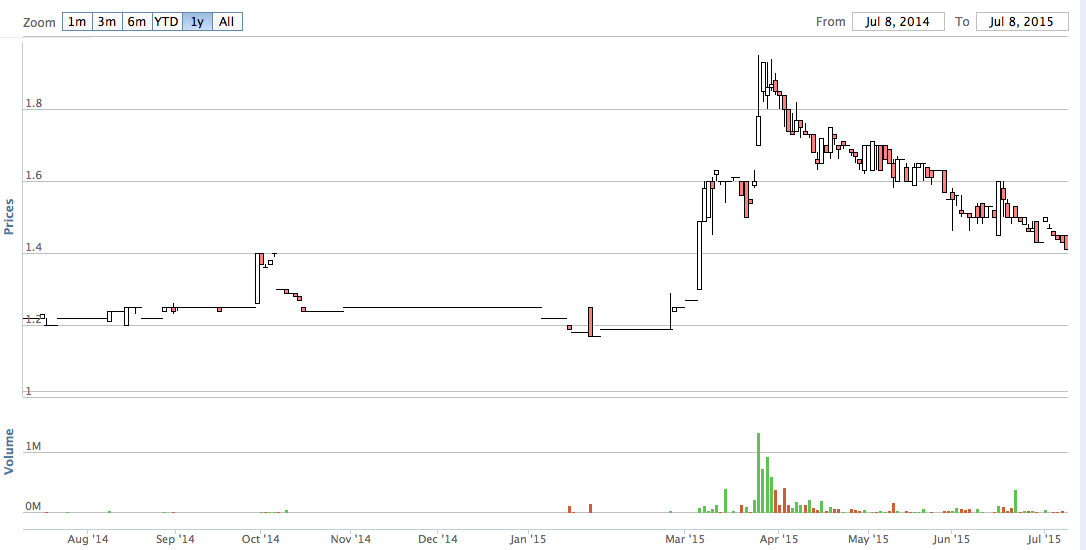
For many years, Imaspro has been trading at approximately RM1.20. However, in March 2015, the major shareholder of Yu Neh Huat (well known for his involvement in tussle over Hong Leong Capital) acquired a substantial stake in Imaspro. It generated a lot of excitement and share price spiked to as high as RM1.90.
Over the subsequent few months, as excitement dies down, share price gradually retraced to existing level of approximately RM1.40. Based on my observation, the sellers (probably got trapped during the spike) are still offlaoding in the market. Please bear this in mind if you are interested to invest in this counter.
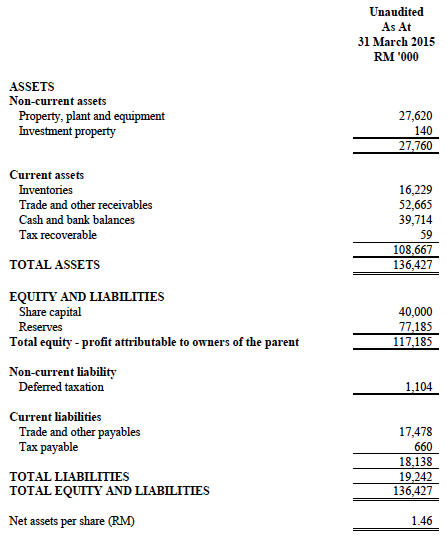
3. Strong Balance Sheets and Free Cashflow
Imaspro has strong balance sheets. The group is in net cash position with net assets of RM117 mil, zero loan and cash of RM39.7 mil. Based on 80 mil shares, it has net cash of RM0.50 per share (35% of share price).
The Group spent very little on capex. Over the past six years, the group generated total net operating cash flow of RM65.7 mil but only needed to invest RM13.7 mil in plant and machineries (21% of surplus cash flow generated from operations).
| FYE June | 2009 | 2010 | 2011 | 2012 | 2013 | 2014 | TOTAL |
| operating Cflow b4 WC changes | 9.7 | 11.7 | 12.0 | 7.6 | 10.4 | 14.3 | 65.7 |
| acquisition of PPE | 1.3 | 1.6 | 1.7 | 1.2 | 1.5 | 6.4 | 13.7 |
Over the past few years, the company paid dividend of 3.5 sen per share. Based on RM1.41, yield is 2.5%.
4. Historical Profitability
The group has been consistently profitable since listing :-
| F.Y. | Revenue ('000) | Profit Attb. to SH ('000) | EPS (Cent) | PE | DPS (Cent) | DY | NAPS | ROE (%) |
|---|---|---|---|---|---|---|---|---|
| TTM | 108,454 | 10,028 | 12.54 | 11.25 | 3.50 | 2.48 | 1.4600 | 8.59 |
| 2014-06-30 | 108,423 | 9,142 | 11.43 | 10.68 | 3.50 | 2.87 | 1.3800 | 8.28 |
| 2013-06-30 | 105,168 | 7,503 | 9.38 | 9.60 | 3.50 | 3.89 | 1.3000 | 7.22 |
| 2012-06-30 | 76,484 | 5,095 | 6.37 | 13.03 | 3.50 | 4.22 | 1.2400 | 5.14 |
| 2011-06-30 | 86,403 | 8,098 | 10.12 | 9.15 | 3.50 | 3.78 | 1.2000 | 8.43 |
| 2010-06-30 | 76,567 | 8,278 | 10.35 | 8.22 | 3.50 | 4.12 | 1.1400 | 9.08 |
| 2009-06-30 | 83,017 | 6,766 | 8.46 | 10.05 | 3.50 | 4.12 | 1.0800 | 7.83 |
| 2008-06-30 | 150,679 | 16,335 | 20.42 | 7.25 | 3.50 | 2.36 | 1.0300 | 19.83 |
| 2007-06-30 | 85,926 | 10,863 | 13.58 | 11.05 | 3.50 | 2.33 | 0.8500 | 15.98 |
| 2006-06-30 | 81,293 | 6,985 | 8.73 | 13.64 | - | - | 0.7500 | 11.64 |
Based on past 12 months aggregate EPS of 12.54 sen, PER is appriximately 11.3 times at RM1.41.
With closed to 50% of its products exported, the group is a beneficiary of weak Ringgit. As shown in table below, there is a clear trend of profit margin expansion when Ringgit weakens.
| (RM mil) | Mar13 | Jun13 | Sep13 | Dec13 | Mar14 | Jun14 | Sep14 | Dec14 | Mar15 |
| USD : RM | 3.08 | 3.07 | 3.24 | 3.21 | 3.31 | 3.24 | 3.19 | 3.33 | 3.58 |
| Revenue | 38.0 | 26.9 | 21.7 | 28.0 | 32.6 | 26.2 | 18.8 | 24.8 | 38.2 |
| > Msia | 13.5 | 12.4 | 15.1 | 10.7 | 10.0 | 11.2 | 10.4 | 12.9 | 16.7 |
| > Indonesia | 8.5 | 4.9 | 2.8 | 1.8 | 4.8 | 3.4 | 2.7 | 0.0 | 5.3 |
| > Bulgaria | 7.7 | 4.5 | 0.0 | 4.8 | 11.6 | 2.2 | 0.0 | 11.0 | 1.7 |
| > Belgium | 4.3 | 2.2 | 0.0 | 6.1 | 3.0 | 1.6 | 1.9 | 0.0 | 0.0 |
| > others* | 4.0 | 2.9 | 3.8 | 4.6 | 3.3 | 7.9 | 3.8 | 0.9 | 14.5 |
| EBIT | 3.5 | 2.3 | 2.3 | 3.2 | 3.9 | 3.2 | 2.1 | 2.4 | 5.8 |
| EBIT margin (%) | 9.3 | 8.4 | 10.7 | 11.4 | 12.0 | 12.1 | 11.2 | 9.7 | 15.2 |
| Int exp | 0.0 | 0.0 | 0.0 | 0.0 | 0.0 | 0.0 | 0.0 | 0.0 | 0.0 |
| forex gain/loss | 0.2 | 0.0 | 0.4 | 0.2 | 0.1 | 0.0 | (0.0) | 0.6 | 0.0 |
| except items | 0.0 | 0.0 | 0.0 | 0.0 | 0.0 | (2.0) | 0.3 | 0.0 | 0.0 |
| PBT | 3.7 | 2.3 | 2.8 | 3.4 | 4.0 | 1.1 | 2.4 | 3.1 | 5.8 |
| tax | (0.7) | (0.3) | (0.6) | (0.8) | (0.9) | 0.0 | (0.6) | (0.6) | (1.3) |
| Net profit | 2.9 | 1.9 | 2.1 | 2.6 | 3.2 | 1.1 | 1.8 | 2.4 | 4.6 |
| tax rate (%) | 20.0 | 14.2 | 23.1 | 22.1 | 21.5 | 0.0 | 23.3 | 20.0 | 21.6 |
In the latest quarter ended March 2015, the group reported a sterling set of results with net profit reaching all time high of RM4.6 mil, translating into EPS of 5.8 sen per quarter. The impressive earnings was due to strong Malaysia sales (up 29.5%) and export sales (up 270% from average of RM3.9 mil per quarter to RM14.5 mil in latest quarter).
EBIT margin also expanded significantly from the usual 12% to 15.2%.
It is very likely that the surge in Malaysia sales was due to pre GST stockpiling. If that is the case, the coming quarter might not see a repeating of such performance.
However, the strong export sale was truly a bright spot. Was it due to new gained competitiveness from devaluation of Ringgit ? We can only find out when they announce next quarter results by end August 2015.
Have a nice day.
No comments:
Post a Comment