1. Decline in Circulation
According to the table below, newspaper circulation has been on declining trend. The younger generation prefer to get their news from online sources.
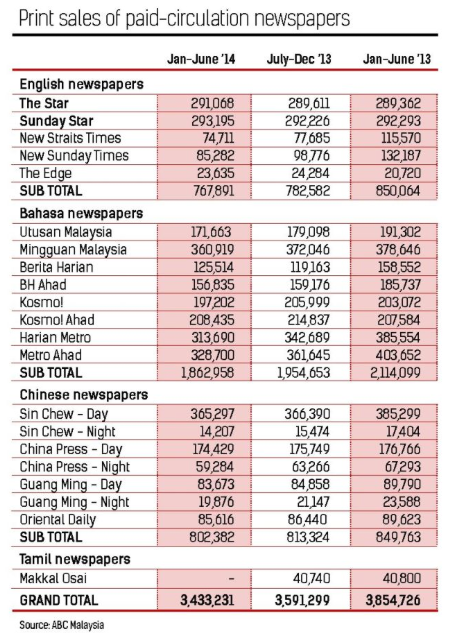
(Source : The Star, 1 December 2014)
2. Strong Free Cashflow
As I go through the group's historical cashflow figures, I was pleasantly surprised.
I have always known that they generate strong operating cashflow, but what surprised me was how little they need to spend on capex.
This is a positive point. It means that the group is not so susceptible to financial stress in the event that earnings are adversely affected by unfavorable operating environment.
The following table sets out MCIL group's cashflow over past few years :-
| FYE 31 March (RM mil) | 2009 | 2010 | 2011 | 2012 | 2013 | 2014 | 2015 |
| Net operating cashflow | 155.4 | 77.6 | 290.7 | 243.5 | 242.3 | 211.2 | 196.6 |
| purchase of PPE & others | (33.0) | (71.9) | (66.3) | (24.1) | (65.2) | (41.4) | (34.8) |
| interest income | 5.5 | 2.3 | 4.1 | 7.8 | 7.4 | 6.3 | 7.9 |
| others | 0.8 | 2.8 | 1.1 | 1.6 | 9.3 | (0.2) | 2.8 |
| Net investing cashflow | (26.7) | (66.8) | (61.1) | (14.7) | (48.6) | (35.3) | (24.1) |
| Net cashflow after investing | 128.7 | 10.8 | 229.6 | 228.8 | 193.7 | 175.9 | 172.5 |
| dividend payment | (75.6) | (33.6) | (85.7) | (122.9) | (811.8) | (113.0) | (71.3) |
| net repayment of loans | (51.1) | 38.2 | (56.3) | (30.0) | 517.0 | (43.6) | (10.1) |
| Net financing cashflow | (126.7) | 4.6 | (142.0) | (152.9) | (294.8) | (156.5) | (81.4) |
| exchange adjustment | (21.0) | 16.1 | 0.0 | (2.0) | (0.5) | (15.6) | (32.8) |
| FCF | (19.0) | 31.5 | 87.6 | 73.9 | (101.6) | 3.8 | 58.4 |
| beginning cash | 240.1 | 221.1 | 252.6 | 340.2 | 414.1 | 312.5 | 316.3 |
| end cash | 221.1 | 252.6 | 340.2 | 414.1 | 312.5 | 316.3 | 374.7 |
| cash | 229.0 | 253.3 | 338.7 | 412.7 | 332.5 | 335.9 | 439.3 |
| loans | 55.5 | 100.5 | 45.6 | 16.2 | 557.1 | 491.6 | 485.5 |
| Net cash | 173.5 | 152.8 | 293.1 | 396.5 | (224.6) | (155.7) | (46.2) |
During the period under review, the group generated aggregate net operating cash flow of RM1.42 billion (average RM202 mil per annum). However, they have only spent a total of RM336 mil on capex (average RM48 mil per annum). This means that on average, they only need to spend 14% of their net operating cash flow on capex.
The group paid out RM1.31 billion dividend from FY2009 until 2015. This translates into average dividend of RM187 mil per annum.
Based on 1.7 billion shares, this translates into dividend per share of 11 sen per annum.
Of course, the above are historical information. Now that the group is not doing so well, we can't expect the same payout going forward.
3. Lower Newsprint Cost
I stumbled upon some information regarding newsprint in Media Prima's annual reports :-
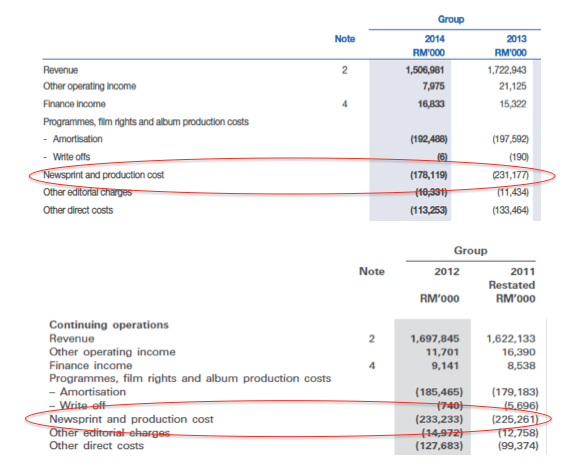
In the past, Media Prima's newsprint cost was approximately RM230 mil per annum. However, in the financial year ended December 2014, newsprint cost dropped by RM52 mil to RM178 mil.
Is the massive drop in newsprint price the reason behind MCIL group's recent spike in gross margin ? (as discussed in Part 2 of my articles)

As shown in table above, in the first quarter of 2015, the revenue of MCIL Group's Malaysia operation declined by RM10.5 mil from RM216.9 mil to RM206.5 mil. However, its PBT jumped from RM44.1 mil to RM60.7 mil.
PBT = Revenue - Cost of Goods Sold - Admin & Distribution Expenses - Interest Expenses
As the group's revenue has declined while interest expenses and admin / distribution expenses had remained more or less the same, the only possible explanation is that Cost of Goods Sold has declined faster than the above items. This could be due to recent decline in newsprint price.
4. Joel Greenblatt's Magic Formula
I learned about the Magic Formula from articles written by a seasoned investor. After reading the book by Joel Greenblatt, I fell in love with the concept instantly. Even though PE Ratio is still my principal tool for stock picking, I have developed a habit to cross check with the Magic Formula for every stock that I study.
Basically, Magic Formula relies on two Ratios to rank companies :-
(1) Return on Invested Capital ("ROIC") in the form of EBIT / Invested Capital, which measures efficieny; and
(2) Earnings Yield ("EY") in the form of EBIT / Enterprise Value, which measures reasonableness of valuation.
The following table is a quick ranking of several stocks I am familiar with.
Companies are ranked based on their combined score. For example : SHL has the fourth highest ROIC and second highest EY. Its score of 6 is the second smallest figures (the smaller the better), as such it is ranked Number 2.

It turns out that MCIL has the highest ranking (meaning that it is most worthy of investing, if you must hear it from me).
The table was compiled without any deliberate efforts to manipulate the stock composition or financial figures. MCIL naturally stands out at the top. I am in the midst of compiling a more comprehensive list. However, I doubt the results will be very much different.
One of MCIL's strongest point is its high ROIC, which is miles ahead of other candidates. This is consistent with earlier observation in Section 2 above about its strong operating cashflow and minimal requirement to invest in capex.
MCIL also ranks Number 1 in Earnings Yield, reflecting market's bearish sentiment on this counter.
5. Diversification ?
In an interview with analysts earlier this year, MCIL management indicated that they might venture into education business in China and / or property development in the future.
If you are ideologically biased against property developemnt, maybe you should not invest in this company.
I took a neutral view on this issue. At the end of the days, it all boils down to specifics, including whether they are able to secure new assets at reasonable price.
No comments:
Post a Comment