Publish date: Sun, 15 May 2016, 01:07 PM
1. Introduction
The Relative Strength Index (RSI) is a momentum indicator which oscillates between zero and 100. It is a very simple tool and many people use it to time their buying or selling :-
(a) when RSI is more than 70, the stock is Overbought. Wait for opportunity to sell.
(b) when RSI is lower than 30, the stock is Oversold. Wait for opportunity to buy.
But what exactly is RSI ? Most people rely on software to plot and read RSI. However, if you can understand how RSI is actually computed, you will have better feel of the concept and what Overbought or Oversold actually means.
2. How RSI Is Computed
RSI calculation is based on 14 periods. It is arrived at based on the following formula :
RSI = 100 - 100 / (1+RS)
where by RS = Average Gain / Average Loss
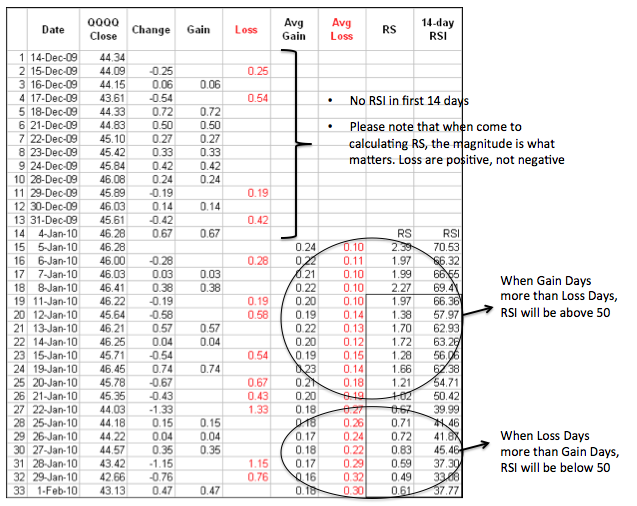
The table below illustrates how RSI is calculated.
First Average Gain = Sum of Gains over the past 14 periods / 14.
First Average Loss = Sum of Losses over the past 14 periods / 14
The second, and subsequent, calculations are based on the prior averages and the current gain loss :
Average Gain = [(previous Average Gain) x 13 + current Gain] / 14.
Average Loss = [(previous Average Loss) x 13 + current Loss] / 14.
For example :
On Day 15, Average Gain = (0.06 + 0.72 + 0.50 + 0.27 + 0.33 + 0.42 + 0.24 + 0.14 + 0.67) / 14 = 3.35 / 14 = 0.24
Average Loss = (0.25 + 0.54 + 0.19 + 0.42) / 14 = 0.10
RS = 0.24 / 0.10 = 2.4
RSI = 100 - 100 / (1 + 2.4) = 100 - 100 / 3.4 = 100 - 29.5 = 70.5
In the above example, since RSI is more than 70, according to definition, the stock is in Overbought position. What exactly is Overbought (and Oversold) ? Does Overbought mean that the stock will definitely (or "very likely") come down ?
If you look at the table carefully, you will notice that Overbought for the abover example corresponds to the following :
In 10 out of the first 14 days, the stock closed with a gain, while 4 out of the first 14 days, it closed with a loss.
Basically, RSI measures how many days in the past 14 days, the stock went up vs. how many days it went down (incorporating the effect of the gain / loss magnitude).
When the number of Gain Days are significantly more than Loss Days, it is defined as Overbought.
When the number of Loss Days are significantly more than Gain Days, it is defined as Oversold.
That is it. Nothing more, nothing less.
Before we proceed further, the following are some of the important thresholds :-
(i) when 7 out of 14 days are Gain Days while another 7 are Loss Days, RS = 7 / 7 = 1.
RSI will be 100 - 100 / (1+1) = 100 - 100 / 2 = 100 - 50 = 50.
(ii) when 14 out of 14 days are Gain Days while none is Loss Days, RS = 14 / 0 = infinity.
RSI will be 100 - 100 / (1+infinity) = 100 - 100 / infinity = 100 - 0 = 100.
This is the extreme of Overbought (as more than 70 is Overbought).
(iii) when zero out of 14 days are Gain Days while 14 days are Loss Days, RS = 0 / 14 = 0.
RSi will be 100 - 100 / (1+0) = 100 - 100 = 0.
This is the extreme of Oversold (as lower than 30 is Oversold).
(Note : for simplicity sake, the above thresholds explanation assumes equal gains / loss magnitude everyday. In real life, those figures fluctuate wildly. However, the overall concept is more or less there)
3. Concluding Remarks
When an apple ripens, it will fall on to the ground. It is governed by law of nature - gravity.
However, RSI is no law of nature. It is just a mathematical definition drawn up by somebody in the 1970s (substantiated by statistics, I supposed). It happened that she sets > 70 as Overbought and < 30 as Oversold. As such, there is no guarantee that when a stock hits Overbought, it will come down (the opposite is true for Oversold).
One good example is EG Industries :
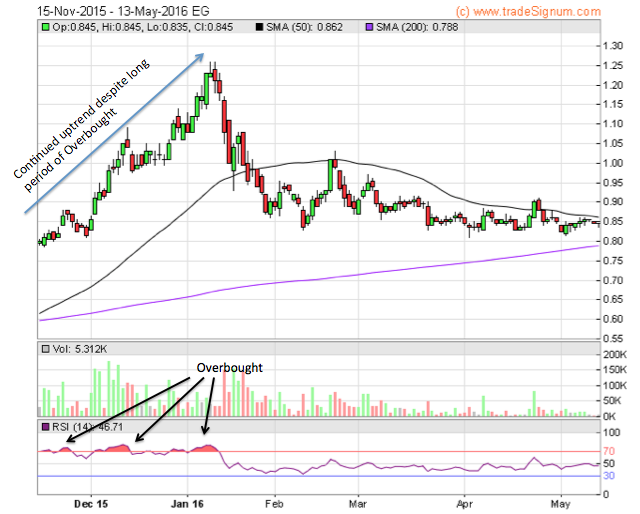
Having said so, Overbought and Oversold are not something to be sneezed at. RSI has quite a high success rate. That is why it is one of the most popular tool among TA fans.
The following is my way of interpreting Overbought :-
Over the past 14 days, the stock has gone up 70% of the time. As what goes up must come down, it is time to watch out for downside risk. However, there is no guarantee that it will do so, as Overbought is merely a mathematical definiftion, not law of nature.
The same is true for Oversold.
Have a nice day.
(a) when RSI is more than 70, the stock is Overbought. Wait for opportunity to sell.
(b) when RSI is lower than 30, the stock is Oversold. Wait for opportunity to buy.
But what exactly is RSI ? Most people rely on software to plot and read RSI. However, if you can understand how RSI is actually computed, you will have better feel of the concept and what Overbought or Oversold actually means.
RSI calculation is based on 14 periods. It is arrived at based on the following formula :
RSI = 100 - 100 / (1+RS)
where by RS = Average Gain / Average Loss
The table below illustrates how RSI is calculated.
First Average Gain = Sum of Gains over the past 14 periods / 14.
First Average Loss = Sum of Losses over the past 14 periods / 14
The second, and subsequent, calculations are based on the prior averages and the current gain loss :
Average Gain = [(previous Average Gain) x 13 + current Gain] / 14.
Average Loss = [(previous Average Loss) x 13 + current Loss] / 14.
For example :
On Day 15, Average Gain = (0.06 + 0.72 + 0.50 + 0.27 + 0.33 + 0.42 + 0.24 + 0.14 + 0.67) / 14 = 3.35 / 14 = 0.24
Average Loss = (0.25 + 0.54 + 0.19 + 0.42) / 14 = 0.10
RS = 0.24 / 0.10 = 2.4
RSI = 100 - 100 / (1 + 2.4) = 100 - 100 / 3.4 = 100 - 29.5 = 70.5
In the above example, since RSI is more than 70, according to definition, the stock is in Overbought position. What exactly is Overbought (and Oversold) ? Does Overbought mean that the stock will definitely (or "very likely") come down ?
If you look at the table carefully, you will notice that Overbought for the abover example corresponds to the following :
In 10 out of the first 14 days, the stock closed with a gain, while 4 out of the first 14 days, it closed with a loss.
Basically, RSI measures how many days in the past 14 days, the stock went up vs. how many days it went down (incorporating the effect of the gain / loss magnitude).
When the number of Gain Days are significantly more than Loss Days, it is defined as Overbought.
When the number of Loss Days are significantly more than Gain Days, it is defined as Oversold.
That is it. Nothing more, nothing less.
Before we proceed further, the following are some of the important thresholds :-
(i) when 7 out of 14 days are Gain Days while another 7 are Loss Days, RS = 7 / 7 = 1.
RSI will be 100 - 100 / (1+1) = 100 - 100 / 2 = 100 - 50 = 50.
(ii) when 14 out of 14 days are Gain Days while none is Loss Days, RS = 14 / 0 = infinity.
RSI will be 100 - 100 / (1+infinity) = 100 - 100 / infinity = 100 - 0 = 100.
This is the extreme of Overbought (as more than 70 is Overbought).
(iii) when zero out of 14 days are Gain Days while 14 days are Loss Days, RS = 0 / 14 = 0.
RSi will be 100 - 100 / (1+0) = 100 - 100 = 0.
This is the extreme of Oversold (as lower than 30 is Oversold).
(Note : for simplicity sake, the above thresholds explanation assumes equal gains / loss magnitude everyday. In real life, those figures fluctuate wildly. However, the overall concept is more or less there)
3. Concluding Remarks
When an apple ripens, it will fall on to the ground. It is governed by law of nature - gravity.
However, RSI is no law of nature. It is just a mathematical definition drawn up by somebody in the 1970s (substantiated by statistics, I supposed). It happened that she sets > 70 as Overbought and < 30 as Oversold. As such, there is no guarantee that when a stock hits Overbought, it will come down (the opposite is true for Oversold).
One good example is EG Industries :
Having said so, Overbought and Oversold are not something to be sneezed at. RSI has quite a high success rate. That is why it is one of the most popular tool among TA fans.
The following is my way of interpreting Overbought :-
Over the past 14 days, the stock has gone up 70% of the time. As what goes up must come down, it is time to watch out for downside risk. However, there is no guarantee that it will do so, as Overbought is merely a mathematical definiftion, not law of nature.
The same is true for Oversold.
Have a nice day.
No comments:
Post a Comment