Saturday, 30 July 2016

CIMB (2) - CIMB Niaga Profit Up 74%. Buy Lah, Wait For What ?

Author: Icon8888   |   Publish date: Sat, 30 Jul 2016, 02:41 PM 

1. Introduction

Yesterday, CIMB Niaga released its June 2016 quarterly report. There was marked improvement in results. Net profit increased by 74% Q-o-Q. 

(Press release spinned it as 318% increase Y-o-Y. However, I think Q-o-Q is more reflective of its latest earning momentum)


2. Results Analysis


(a) Compared with previous quater, net profit increased by 74% to Rp467 bil.


(b) One of the major positive contributor is Net Interest Income, which increased by Rp139 bil compared to previous quarter. The increase is mostly due to decline in interest expenses from Rp2,552 bil in previous Q to Rp2,246 bil (decline of Rp306 bil), mostly due to increase in Current Account Deposit. Net interest margin improved from 53% to 57%. Well done !!!   

(c) The other major contributor is lower impaired loans provision, which resulted in saving of Rp120 bil. This is the second consecutive month of decline, after peaking in December 2015 quarter.

Provision is expected to continue to decline in coming quarters as CIMB CEO hinted in a recent interview that he expects second half of 2016 to perform better. Please refer to my previous article for details.

(d) Operating expenses increased by Rp25 bil. This was a negative surprise. After the mid 2015 Mutual Seperation Scheme, I expect cost to come down, not go up. Anyway, it is not a big issue as the increase is not really that big.


3. Earning Forecast

In my previous article, I have guarded feelings for the CIMB Group. I sensed that they are turning around, but was not sure when the recovery will actually take place. However, with CIMB Niaga announcing a reasonably good set of results yesterday, I have turned much more positive towards the group.

Armed with this new piece of information, I set up a financial model to try to feel the CIMB Group's coming quarter result. 
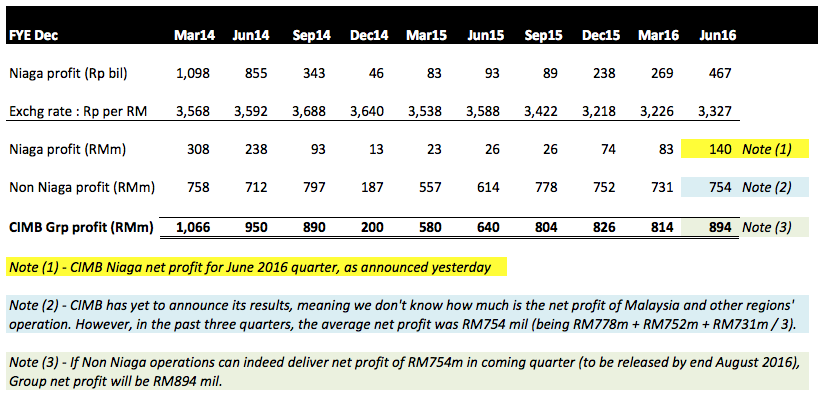


Many people frown upon building financial model to predict future earning. Garbage in garbage out, if you get your assumptions wrong, your prediction will be way off.

However, in this particular case, there is sufficient ground for making such an attempt - the performance of CIMB's non Niaga operation has been fairly stable. In the past three quarters, it has generated net profit of RM778 mil, RM752 mil and RM732 mil respectively. I believe there is reasonable chance that the coming quarter will be more or less the same.

By putting together the above information, the model estimates that coming quarter net profit will be approximately RM894 mil.

But how should we interprete this figure ? What is the implication on valuation ? In other words, what should be the Target Price ? 


4. Target Price

I previously set a Target Price of RM5.20 for the stock. That was plucked from the air based on my entry cost of RM4.29 and expected return of 20%.

However, now that I have a better feel of the Group's positive momentum, I am happy to revise it upwards. For inspiration and guidance, I looked back to early 2014 when CIMB was still doing well.


As shown in the diagram above, CIMB traded at RM7.30 based on quarterly profit of RM1.066 bil in March 2014. The coming quarter of RM894 mil predicted net profit, if materialised, will be approxmimately 84% of its March 2014 quarter profit.

By applying 16% discount to RM7.30, I arrived at revised Target Price of RM6.13 for CIMB over the next 12 months.

This represents potential upside of 40% over latest closing price of RM4.39.


5. Concluding Remarks

(a) Among all the banking stocks, I believe CIMB has the best long term growth potential. This is because of the relatively high weightage of its Indonesian operations. Indonesia's GDP per capita is still low and its population is huge. The country will conitnue to grow at a brisk pace for many years to come, dragging CIMB along with it.
(b) The Group's past 12 months performance was disastrous. Its exposure to Indonesia became a big liability, dragging down its overall profitability as Indonesia floundered under the tremendous downward pressure caused by collapse of commodity prices.

(c) However, this weakness has now become its strength. From investing point of view, CIMB has bigger upside potential compared to other banking stocks such as AFG, Public Bank, Hong Leong Bank, BIMB, etc, which have done reasonably well operationally.

(d) With the Indonesian economy now gaining strength, I believe we have reached an inflexion point for CIMB. The risk and reward ratio going forward looked favorable. It is time to stop sitting on the fence.

Buy lah, wait for what ?

CIMB (1) - Undervalued, But Patience Required


Author: Icon8888   |   Publish date: Wed, 27 Jul 2016, 09:36 PM 

1. Introduction

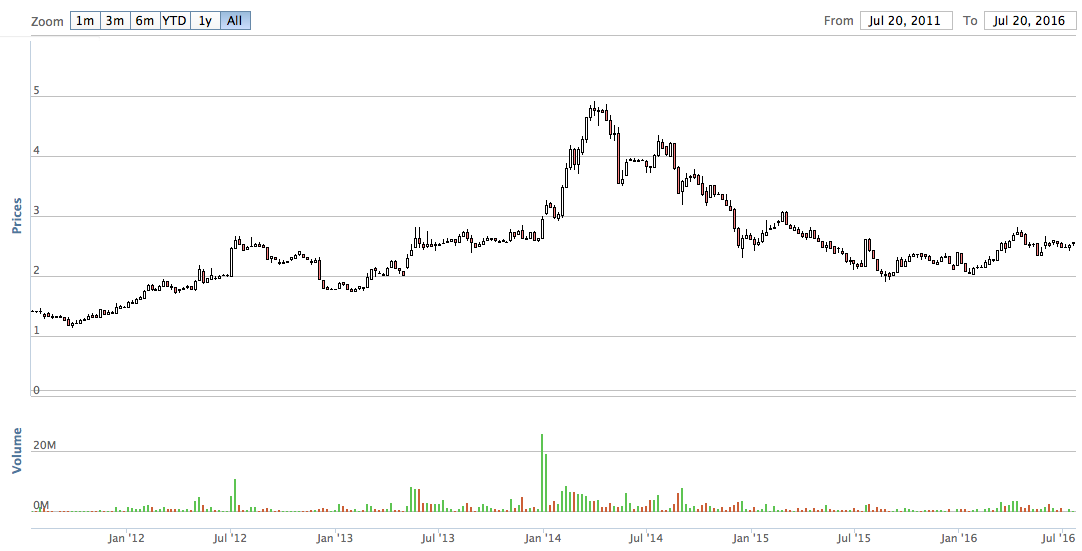
CIMB used to trade as high as RM8.70 back in May 2013. It is currently trading at RM4.29 (down 51%).


The downtrend was caused by decline in profitability. In 2013, CIMB reported net profit of RM4.54 billion. In the latest financial year, its profit had declined by 40% to RM2.85 billion.

Annual Result:
F.Y.Revenue ('000)Profit Attb. to SH ('000)EPS (Cent)PEDPS (Cent)DYNAPSROE (%)
2015-12-3115,395,7902,849,50933.6213.5114.003.084.81006.99
2014-12-3114,145,9243,106,80837.4814.8415.002.704.44008.44
2013-12-3114,671,8354,540,40359.9712.7123.823.133.920015.30
2012-12-3113,494,8254,344,77658.4513.0623.383.063.810015.34

The stock looked interesting as it is currently trading at Price to Book Ratio of 0.88 times. A banking group like CIMB should trade at at least 1.5 times when its earnings recovers.

(When come to banking stocks, the Market has been quite fair and rational. The higher the ROE, the higher the valuation multiples).

The purpose of this article is to try to understand what are the major factors dragging down CIMB's earning in recent years and to try to have a feel of whether it will be turning around soon.


2. Historical Profitability


Key observations :-

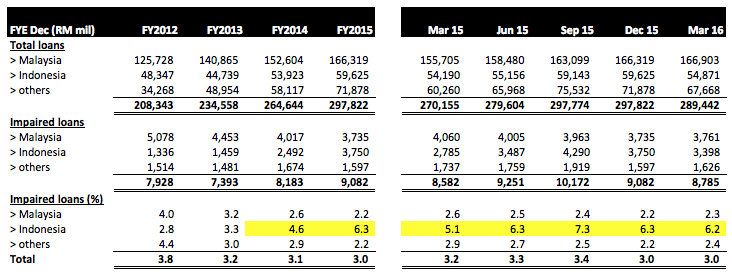
(a) Loan impairment was the main reason CIMB's performance deteriorated over the years. In FY2012 and 2013, impairment charges were 6.1% and 11.7% of profit before impairment respectively. However, in FY2014 and 2015, it increased to 29.1% and 37.7% respectively.   

(b) Indonesia subsidiary CIMB Niaga accounted for the bulk of the bad loan spike. 


As shown in table above, in FY2012 and 2013, only about 3% of CIMB Niaga's loans were impaired. However, in FY2014 and 2015, that has increased to 4.6% and 6.3% respectively.

Compared to Indonesia, Malaysia and other regions had been managing their loan books pretty well with impairment of 2% plus in FY2014 and 2015.

According to the company, collapse of commodity prices was the main reason for the spike in Indonesia bad loans. Indonesia relied quite heavily on commodity export. The downturn caused many borrowers to get into difficulties. 

(c) In a recent interview with The Star, the CEO of CIMB expects Indonesia operation to perform better in second half of 2016.


(d) To improve performance, CIMB launched a campaign in 2015 called T18 (Target 2018) to revamp its operation. Among the measures put in place is reduction in overhead. The group's Cost to Income ratio has inched up in FY2015. The group targets to bring it down to 50% by 2018 (The group retrenched more than 3,000 employees in 2015 through a Mutual Separation Scheme).   


3. Concluding Remarks

(a) By virtue of its 0.88 times PBR, I believe that CIMB is undervalued at current price of RM4.29. However, re-rating will only happen if its earnings improve.

(b) As mentioned above, the main reason the group's profitability has declined so much is because of non perfoming loans of its Indonesia subsidiary. After going through two rough years, there are signs that the Indonesian economy is gaining strength. CIMB's CEO has hinted of better performance in second half of 2016. Will that materialise ? We can only find out over time.

(c) The reason I invest in CIMB is because I believe it has limited downside. I do not have high expectation for this stock. If it can deliver 20% return for me by end of 2016 (Target Price of RM5.20), I will be very happy.

Borneo Oil (2) - Struck Gold Worth RM270 mil


Author: Icon8888   |   Publish date: Thu, 21 Jul 2016, 10:19 AM 

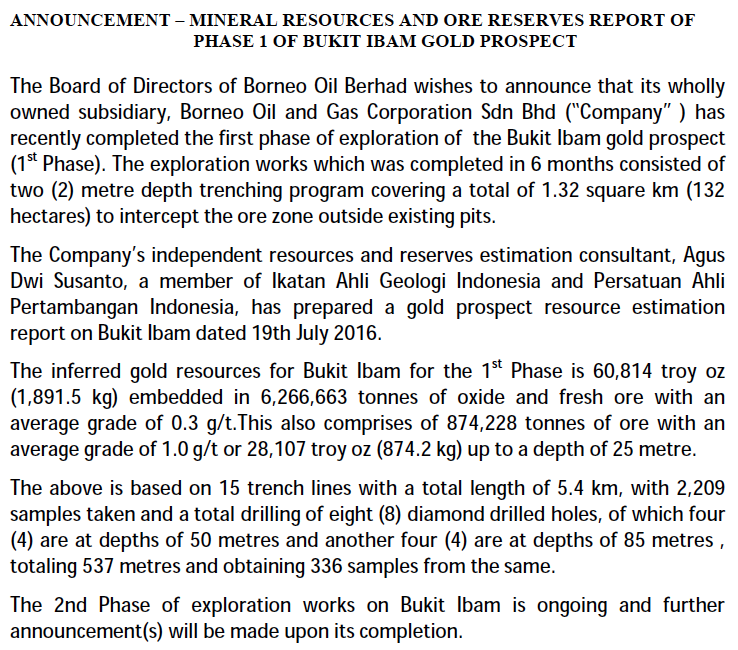
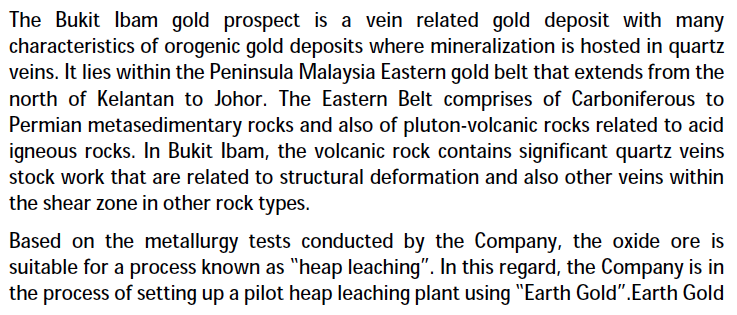
On 19 July 2016, Borneo Oil announced that its exploration activities had uncovered estimated Gold reserve of 1,892 kg in its Bukit Ibam Mine in Pahang. Based on conservative Gold price of RM150,000 per kg, the reserve is worth RM270 mil.

Upon publishing my first article, one of the major negative feedback from my readers is that Borneo Oil's existing gold inventories might have been obtained through trading activities instead of mining. This was later confirmed by the Company in its announcement dated 11 July 2016.

However, this latest discovery of physical Gold finally put the issue to rest. Borneo Oil's Gold is no more a figment of imagination. And it is only just the beginning. Borneo still have many promising sites which are pending exploration. 

When I first started investing in Borneo Oil, I was a bit skeptical of its fundamentals. However, now I would say that I have more comfort with it. Hopefully they will announce further discoveries in the future. 


MKH - Strong Earning Momentum


Author: Icon8888   |   Publish date: Wed, 20 Jul 2016, 04:03 PM 


1. Introduction


MKH recently reported two consecutive quarters of strong earnings.

Quarter Result:

F.Y.QuarterRevenue ('000)Profit Attb. to SH ('000)EPS (Cent)DPS (Cent)NAPS
2016-09-302016-03-31322,23155,37913.20-2.8300
2016-09-302015-12-31266,36561,57014.687.002.7100
2015-09-302015-09-30348,71024,4115.82-2.6300
2015-09-302015-06-30255,83820,8864.98-2.5400
2015-09-302015-03-31229,72010,9042.60-2.4900
2015-09-302014-12-31207,63430,1297.188.002.4600

Are those earnings real ? Are they sustainable ? Let's take a look.


2. Background Information

MKH is principally involved in property development. In 2008, it ventured into oil palm plantations in Kalimantan, Indonesia. It completed planting the entire 14,400 Ha by 2011.  


Based on 420 mil shares and latest price of RM2.55, market cap is RM1.07 billion. Based on past twelve months aggregate net profit of RM162 mil, historical PER is 6.6 times.

The group has net assets of RM1.2 billion, loans of RM827 mil and cash of RM296 mil. As such, net gearing is 0.44 times. 

Out of RM827 mil borrowings, RM326 mil is denominated in US Dollars (which explained why the group incurred huge forex losses in past few years). The USD borrowings were used to finance the group's plantation capex in the past few years.  

According to FY2015 annual report, the USD borrowings are repayable over 5 tranches as follows :-


As trees are now matured and producing FFBs, the group should be very comfortable servicing its debt obligations going forward.


3. Historical Profitability


Key observations :-

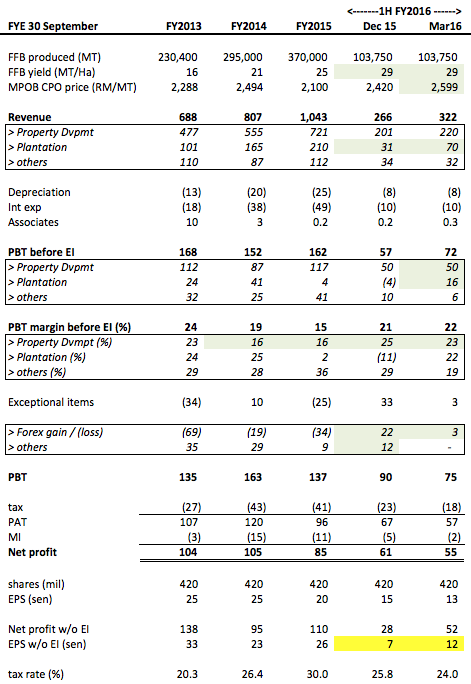
(a) Plantation division reported PBT of RM20 mil in March 2016 quarter. However, there was net forex gain of RM3 mil. Excluding that item, core PBT would be RM17 mil per quarter.

(b) Property division generated PBT of RM62 mil in December 2015 quarter. However, there was a government grant of RM12 mil. Excluding that item, core PBT would be RM50 mil. That translated into PBT margin of 25%. It is not clear whether this high profit margin is sustainable as in FY2014 and FY2015, property division's PBT margin was only 16%.

(c) Property division generated PBT of RM50 mil in March 2016 quarter. That translated into PBT margin of 23%. Same as above, it is not clear whether this high profit margin is sustainable.

(d) After stripping off the forex gain and government grant, MKH's core EPS for 1H FY2016 is 19 sen (being 7 sen + 12 sen).

(e) The following factors will determine whether the recent two quarters' strong profitability can be sustained going forward :-

(i) Property division - It is unclear how much progress billing will be booked in in the coming quarters. However, the group has unbilled sales of RM800 mil plus and will be launching closed to RM1 billion new projects this year.

(ii) FFB yield - At average age of 7 years, the group's palms are still growing. FFB yield is expected to continue to increase over next few years.

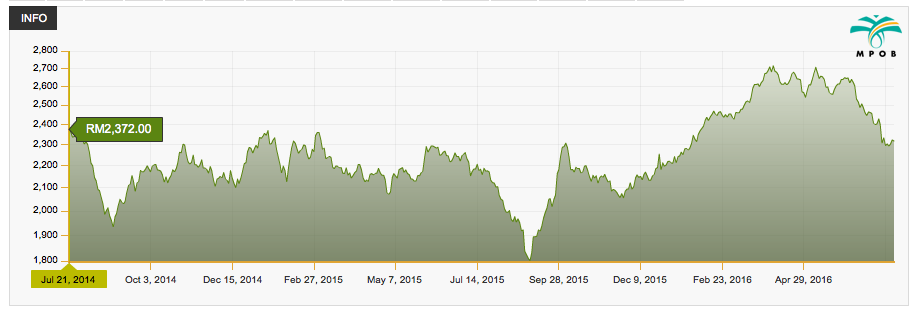
(iii) CPO price - During the period from April until June 2016, average CPO price was RM2,599 per MT. This is higher than the March 2016 quarter's RM2,420 per MT.


4. Property Projects

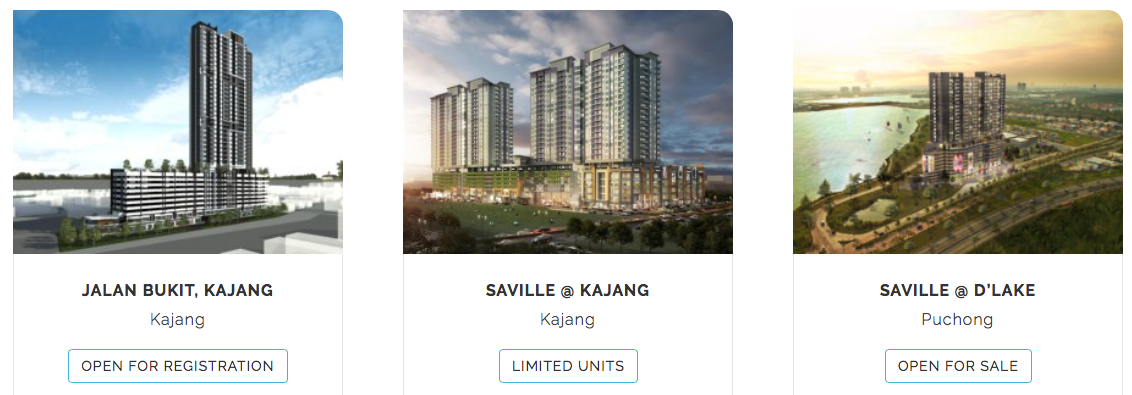
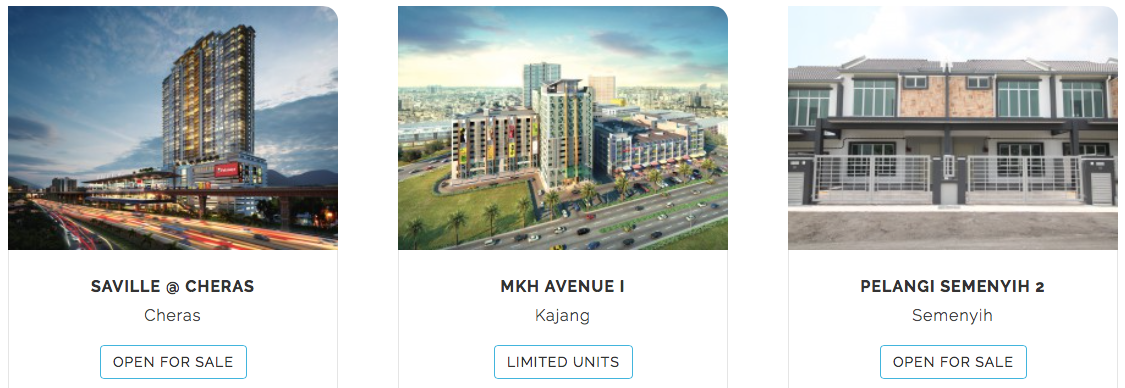
The following are the group's ongoing projects :-


I notice that they are mostly located in popular and matured residential areas.


5. Super Trees

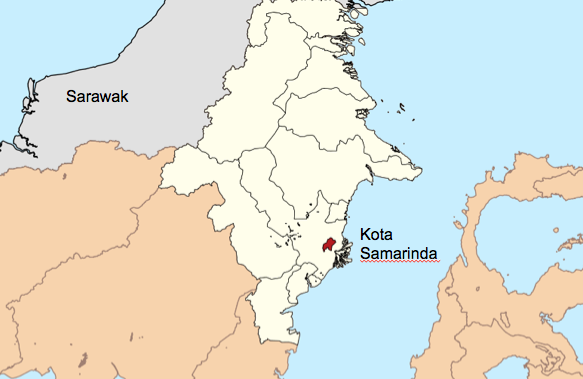
MKH's plantations are located at Kota Samarinda, East Kalimantan. The region was not affected by the recent El Nino. As such, MKH enjoyed the best of both world - high yield + high CPO price during 1H 2016.


MKH's Kalimantan plantations have exceptionally high FFB yield. A comparison of their yield with industry average is as set out below :-


As shown in table above, MKH's yield are SUBSTANTIALLY higher than industry average.

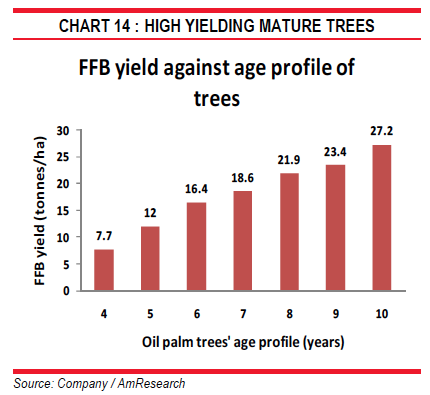
For example, in 2016, with trees at 7 years old, the group's FFB yield is expected to reach an astounding 29 MT per Ha. To get a feel of how good those yields are, just compare it with Uncle Koon's blue eye boy, Jayatiasa. According to this analyst report published by AmResearch in January 2014, Jayatiasa's 7 years old trees are expected to produce 18.6 MT FFB per Ha.  


MKH did not explain why its yield is so impressive. However, I did hear before of such cases of exceptionally high yield in Indonesia, especially in region of fertile volcanic soil. If anybody knows the answer for MKH, please drop me a note.


6. Potential Listing Of Plantation Division Soon ?

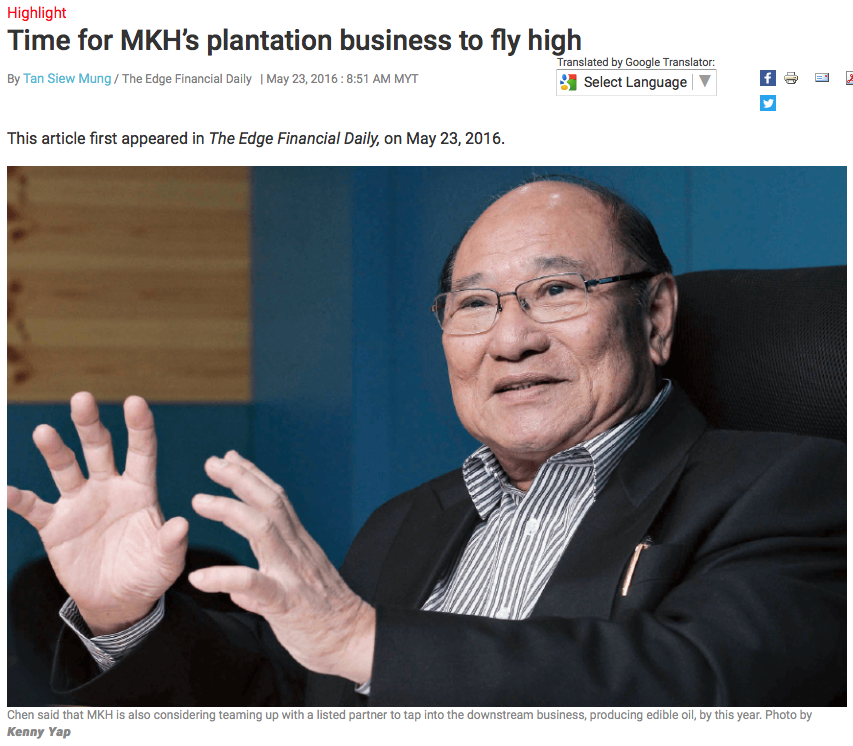
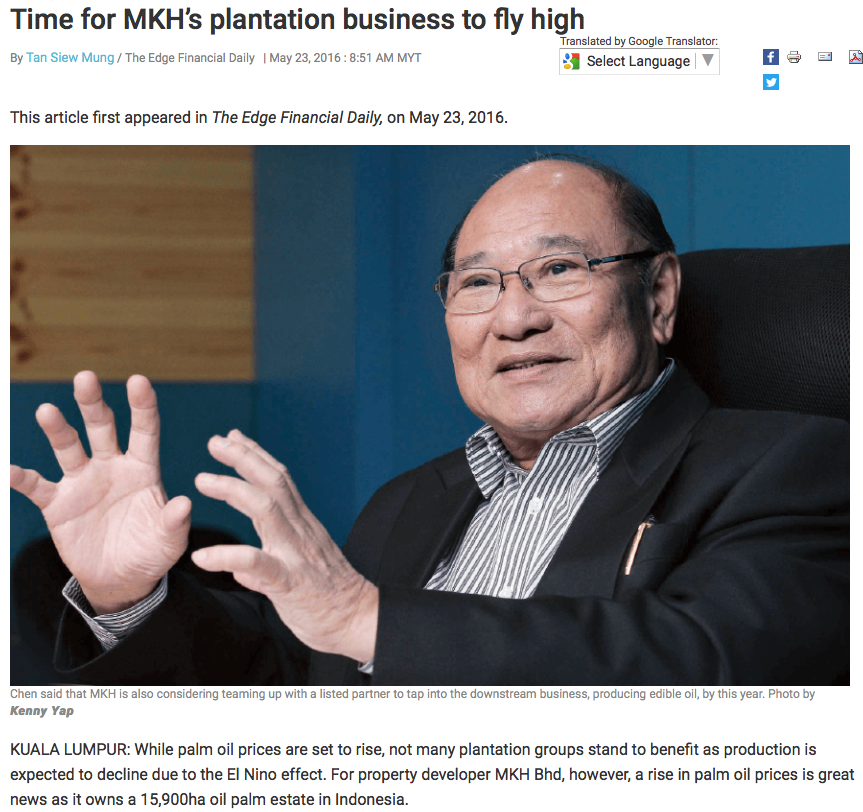
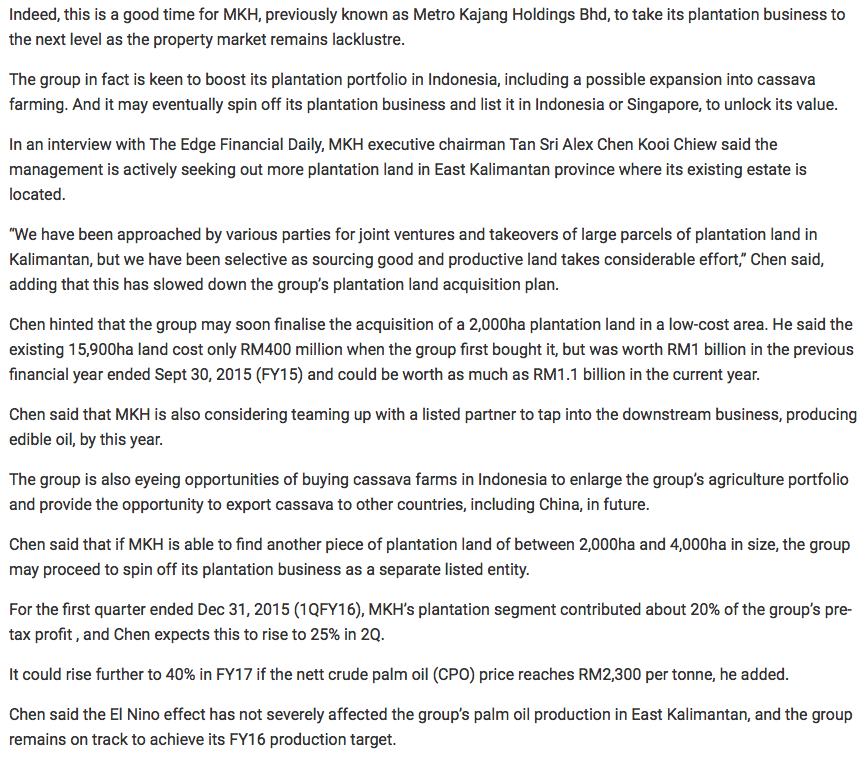
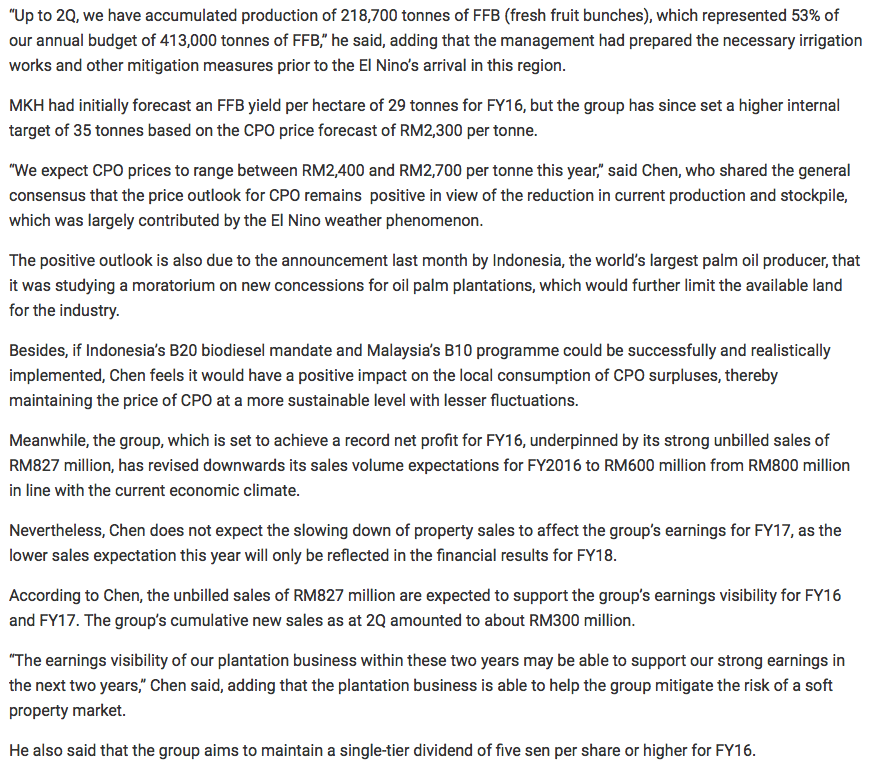
In an interview with The Edge in May 2016, the company's Executive Chairman mentioned that they might list the plantation division if they were able to secure another 2,000 to 4,000 Ha of plantation land.


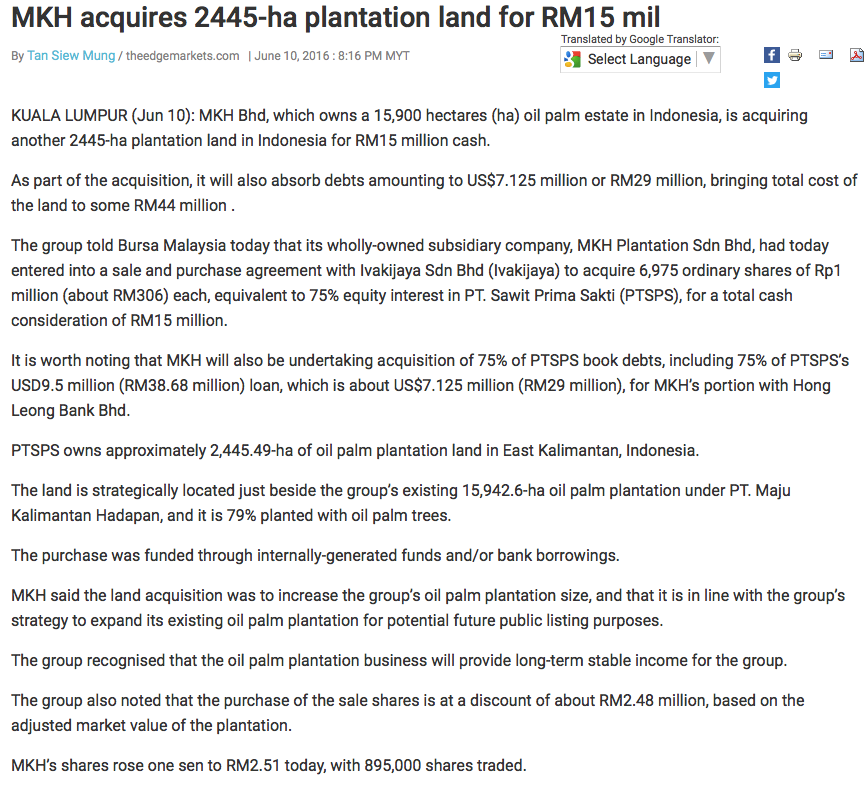
His wish came true sooner than expected. On 10 June 2016, MKH announced that it is acquiring 75% of PT Sawit Prima Sakti (PTSPS) for cash consideration of RM15 mil. PTSPS owns 2,445 Ha of plantation land in East Kalimantan.

Does that mean that the listing will happen very soon ? Let's just wait and see.


7. Concluding Remarks

(a) MKH attracted my attention because it has performed well in recent two quarters. 

(b) Its plantation division generated core PBT of RM17 mil in latest quarter. For discussion sake, let's assume that the same performance can be repeated in next few quarters (FFB yield expected to remain strong while June 2016 quarter CPO price is higher than that of March 2016 quarter).
Based on annualised PBT of RM68 mil, tax rate of 25% and MI of 5% (Indonesian partners), can this division deliver net profit of at least RM48 mil ?

(c) Property division generated core PBT of RM50 mil in latest quarter. If annualised, full year PBT will be RM200 mil. However, this could be too aggressive. To be prudent, I prefer past 3 years average PBT of approximately RM110 mil. 
Based on 75% tax rate, can this division deliver net profit of RM82 mil ?

(d) The group's other divisions (investment properties, trading, etc) generated PBT of approximately RM25 mil per annum in the past.
Based on 25% tax rate, can those divisions deliver net profit of RM19 mil ?  

(e) By putting all the above figures together, I arrived at theoretical net profit of RM149 mil. Based on 420 mil shares, EPS is approximately 35 sen. Based on latest price of RM2.55, prospective PER of 7.3 times ?

(f) Can the above EPS be achieved ? Nobody knows. I guess we can only find out over time. 

Have a nice day.


Appendix - The Edge Article Dated 23 May 2016


Puncak Niaga - RM2.67 Net Cash Per Share Provides Huge Margin of Safety For RM1.08 Share Price


Author: Icon8888   |   Publish date: Mon, 18 Jul 2016, 03:41 PM

1. Huge Cash Pile Post Assets Disposal

Since I started blogging in 2014, I believe this will be the first time I make a Buy call based on Balance Sheets.

Puncak was previously the water concessionaire for the State of Selangor. It sold its water assets to the government in 2015 and received RM1.56 billion cash.

During the same year, it undertook a distribution of RM1.00 cash per share back to shareholders. Upon completion of the corporate exercise, it was left with cash of RM1.26 billion (comprises RM335 mil cash and RM927 mil short term investment).

Puncak has borrowings of RM57 mil. As such, net cash is about RM1.2 billion.

Based on 450 mil shares, that is equivalent to RM2.67 cash per share.


2. Historical Share Price

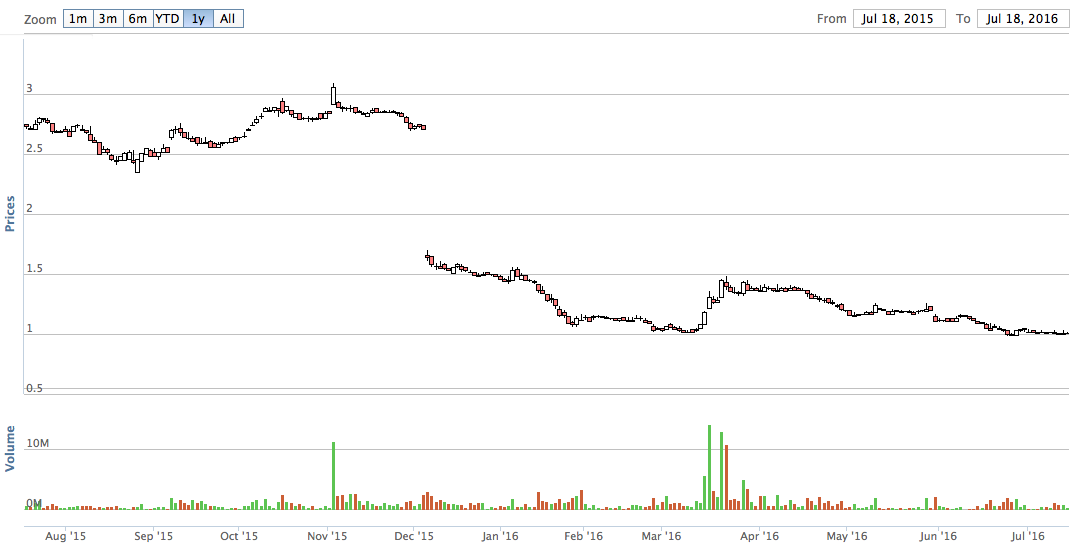
Since the completion of distribution of RM1.00 cash per share by end 2015, the stock has been trading at around RM1.00.


3. Proposed Acquisition of TRIplc

On 18 April 2016, Puncak announced that it has entered into Heads of Agreement to explore the possibility of acquiring the assets of TRIplc. This is a related party transaction as Tan Sri Rozali is the major shareholder of both Puncak and TRIplc.


Based on 66 mil shares and latest price of RM2.25, TRIplc's market cap is approximately RM150 mil.

TRIplc is the owner of government concession to provide facilities and infrastructure management for UiTM campuses. The concessions will last for more than 20 years. In the latest financial year, TRIplc reported net profit of RM7 mil.


4. Concluding Remarks

In my opinion, Puncak is undervalued at current price. The major risk investing in this stock is possible injection of assets by major shareholder at inflated value. However, at 60% discount to cash per share of RM2.67 and 70% discount to net asset per share of RM3.67, I believe the margin of safety is big enough to warrant a BUY.

Have a nice day.

Air Asia (10) - All Over The World, Airline Stocks Had Been Re-Rated Over The Past Two Weeks


Author: Icon8888   |   Publish date: Sat, 16 Jul 2016, 05:06 PM 

First of all, hat tip to forum member Ricky Kiat for referring me to this video, which discussed why the next ten years will be Golden Era for Airline companies.
https://www.youtube.com/watch?v=36ANWfKqL6g&feature=player_embedded

Inside the video, it was mentioned that over the past two weeks, Airline stocks ALL OVER THE WORLD had gone up. I did a quick check and confirmed that this is indeed the case. 

It seemed that there is a positive change in sentiment towards airline stocks globally. In my opinion, it is wise to hold on to Air Asia and let the profit run.

Please go through the video if you are interested to find out more about the prospects of airlines.