Sunday 8 May 2016

Air Asia Call Warrants - Which One Will Give You Best Flight Experience ?

Tomorrow morning, Air Asia will convene EGM for the private placement of 559 mil new shares to Tony Fernandes at RM1.84 per share. There is a likelihood that share price will rally post approval as it removes a huge overhang. Of all the Call Warrants listed on Bursa, which one is the most attractive ?


With trading volume of more than 12 mil shares in one day, it looked like C31 is the most popular. It will expire in another 98 days. However, it is almost in the money. Due to the low conversion premium of 2%, your risk of investing in this instrument is almost same as investing in mother shares IF you are prepared to "exercise" the Warrants by buying mother shares as continuing exposure upon Warrants expiry.

In my opinion, C27 and C28 are even better as their conversion premium of 3.47% and 4.46% respectively are only slightly higher than C31 but their lifespan of 172 days is almost double that of C31.

C30 is unique because it has almost one year's lifespan (266 days). However, its conversion premium is 8.91%, higher than most other Warrants.

Different people have different risk appetite. I think all of them are reasonably good and worth a punt, except for C33 and C34, which has high conversion premium of more than 20%.


Friday 6 May 2016

Why FA Investors Like You And Me Should Learn TA

Publish date: Fri, 6 May 2016, 03:12 PM 


1. Hungry For Information

Last night 11.41 pm I published the article about MACD. By 9.30 am today, the article achieved more than 3,500 hits. I was pleasantly surprised by the high readership. Many forum members know me for my Fundamental Analysis. The fact that they bother to read my TA article shows that they are hungry for information about this field. 

I am encouraged by the favorable response. It motivated me to write more.


2. How I Write My TA Articles

When come to FA, ideas and information flow naturally for me. I have been punting based on FA since day one. So there is plenty of things for me to write about. 

How about TA ? Icon8888 is not a TA expert, where does he get the information from ? Can his information be trusted ? Are the information and concepts correct ?

This is actually my second attempt to write about TA. I have written a few articles at the beginning of 2016. I did it by copy and paste relevant sections from Investopedia website, highlight them by underlines and made some comments on the material. However, very soon, I lost interest and stopped writing. I am not comfortable just copy and paste information without processing or adding value. That format is too unsophisticated. It wastes my readers' time. I better stop writing before people grow bored of me.

This round I used a different method. I don't write an article until I am familiar with the topic. No more half baked potatoes. Full meals will be served.

In order to do that, I learned the various TA topics through a combination of the followings :-
(a) read aticles (mostly from Investopedia website);
(b) watch Youtube; and
(c) study chart samples (through Google Image).

On average, I should be able to have a pretty good grasp of the topic once I went through approxmiately 10 articles, Youtube videos and charts each. The information obtained therefrom might not turn me into an expert, but it is usually sufficient to cover the bulk of the issues, providing me wtih plenty to write about.


3. What Should We Aim For ?

Not everybody is enthusiastic about my quest for TA knowledge. One forum member commented that TA is nothing more than fanciful tool. Since I am new to TA, I was not able to counter his statement convincingly (even though my gut feeling tells me that he is very likely wrong). However, as I studied Relative Strength Index (RSI) recently, one unexpected benefit shows up - familiarity with TA will allow you to differtentiate whether somebody is bluffing you (BS you, if you don't want to mince words).

Previously, when somebody says that "this stock's RSI shows that it is now in Overbought Position, it is time to sell", there is nothing a TA illiterate like me can do. I can only keep quiet (and probably sell off the shares, if I have weak heart). But now that I have a better understanding of RSI, I know that he is only telling 50% of the story. According to what I have learned, a stock can be Overbought for a long time without going into trend reversal, you need to wait for change in momentum (MACD as indicator) before you press the Sell button.

In my opinion, that is the most important benefit of knowing TA - we are no more kindergarten kids being pushed around, we are now in a position to ask the right questions. 

We need not be so skillful until we can use TA to identify trends or generate Buy / Sell signals (there is no harm also, if you can achieve that ultimately). However, we should know enough to be able to question, digest and absorb what TA experts tell us.

The analogy to learning a new language is this :-

We don't necessarily need to know how to write, but at least we need to know how to read with the new language.

That is the most basic thing we should aim for at this stage of our learning cycle.


Moving Average Convergence Divergence (MACD)

Author: Icon8888   |   Publish date: Thu, 5 May 2016, 11:41 PM


1. Introduction

MACD (pronounced as MAC D) is a popular tool many traders use. The calculation behind the MACD is fairly simple. Essentially, it calculates the difference between 12-day and 26-day Exponential Moving Averages (EMA).

MACD = 12 Day EMA - 26 Day EMA

The calculation of both EMAs uses the closing prices of whatever period is measured. 

On the MACD chart, a nine-day EMA of MACD itself (Signal Line) is plotted as well. 


2. Buying and Selling Based On MACD

Three ways to read MACD :

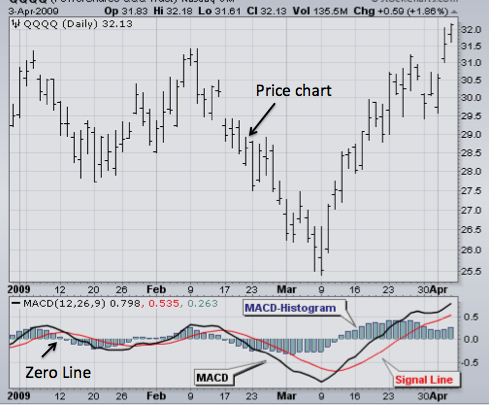
(i) Cross Over of Zero Line - When MACD is positive (above Zero Line), the stock's price is in bullish territory. The opposite is true when MACD is negative. As such, a cross over from positive to negative signals a trend reversal.
In other words, MACD crosses above and below Zero Line is a Buy and Sell signal respectively.
(ii) Cross Over of Signal Line - MACD crosses above and below Signal Line is also a Buy and Sell signal respectively. 
This can also be done through reading the Histogram. Histogram is the difference between MACD and Signal Line. When MACD crosses Signal Line, the value of histogram will be zero. 

When come to Histogram, it is good if the value is huge. A huge distance between MACD and Signal Line means that momentum is continuing in the desirable direction. Based on the same principle, a shrinking Histogram is something to be monitored closely - always remember that a zero histogram is equivalent to MACD crossing over of Signal Line, a trend reversal.

What is the relationship between Zero Line crossover and Signal Line crossover ? You can rely on either one to detect Buy and Sell signals. However, Signal Line crossover is more sensitive than Zero Line. It gives earlier signal. Usually only after Signal Line crossover, Zero Line crossover will happen.


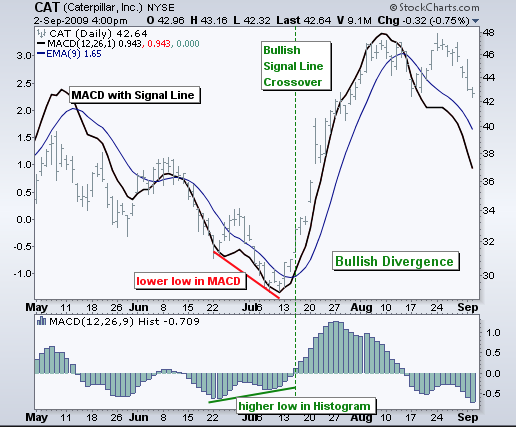
As shown in chart above, MACD (Blue Line) always crosses Signal Line (Red Line) before it finally crosses Zero Line (Black Line). As such, if you rely on Signal Line cross over, you will always Buy / Sell earlier than the person who relies on Zero Line cross over. 

The weakness of method (i) and (ii) above is that when market moves sideway, you will have problem of Whipsawing (frequent signals of Buy and Sell). Method (iii) below faces less such problem.

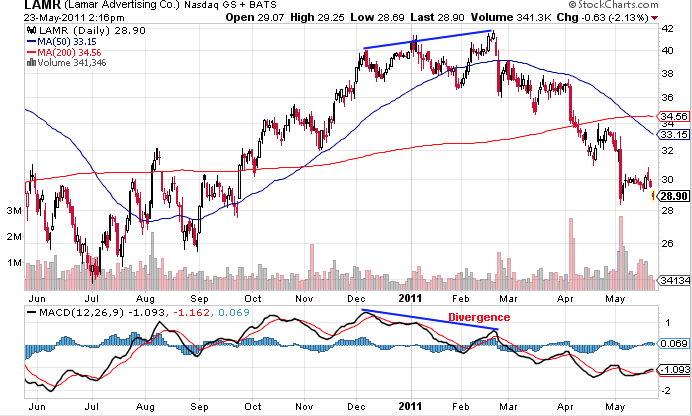
(iii) Divergence - Divergence happens when price chart is trending down while MACD trending up (Buy signal).


On the other hand, price chart trending high while MACD trending low is a Sell signal. 

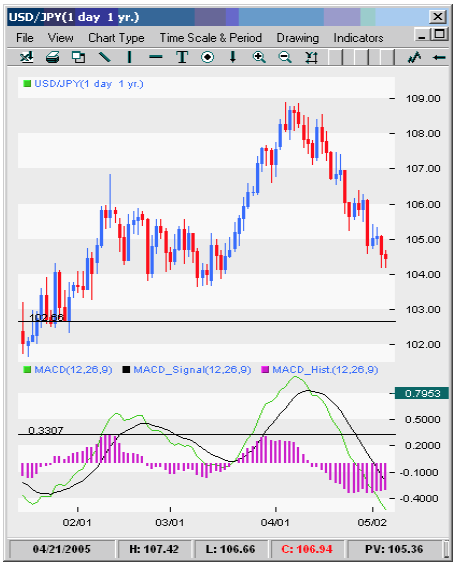
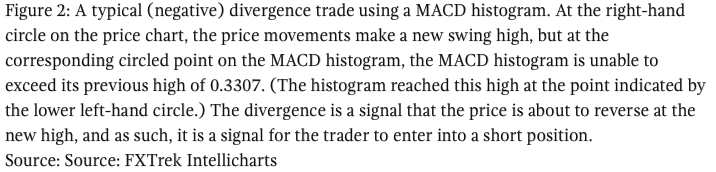
Alternatively, you can use MACD Histogram vs. price instead of MACD vs. price to detect Divergence.

Alternatively, instead of comparing price chart with MACD, Divergence can be detected by comparing Histogram with MACD.


(3) Last But Not Least

Just like any other technical tools, MACD will serve you well when there is a clear trend. When price sideways, you will be whipsawed to death.

* 4 Million Pageview For Icon8888 Blog *

Author: Icon8888   |   Publish date: Wed, 4 May 2016, 10:47 AM 


I first started blogging in March 2014.

On 11 July 2015, I reported that my blog in i3 achieved 1 mil pageview. It was achieved through 147 articles over a period of 15 months. Average readership was 6,802 per article. 

On 25 December 2015, I reported that my blog achieved 2 mil pageview. It was achieved through 48 articles over a period of 6 months. Average readership was 15,696 per new article. 

On 3 February 2016, I reported that my blog achieved 3 mil pageview. I published 27 articles over a period of 1.5 months. Average readership was 20,497 per new article. 

Today, I am happy to report that my blog pageview has reached 4 mil. I published 20 articles during the period of 3 months. Average readership was 26,810 per new article.


I would like to thank all my readers for their support.

Cheers !!!

5 Reasons To Be Greedy When Others Are Wary of Air Asia

Author: Icon8888   |   Publish date: Thu, 14 Apr 2016, 02:52 AM 


No introduction required, I will go straight to my 5 points as per below.

1. Early Stage of Re Rating  Those who have experienced the 2015 furniture stocks bull run will agree with me that we are still at early stage of re rating for Air Asia.
The furniture industry re rating began in early 2015 and lasted for one full year. Many stocks in that sector went up by few hundred percents. If not because of recent strengthening of Ringgit, the process would likely have continued.
Good companies with strong earnings visibility are not easy to come by. If you bump into one, cherish the opportunity and hold on to the stock. Don't kill the goose that lay the golden eggs so soon.
LET THE PROFIT RUN.

2. Still Undervalued   Air Asia is expected to do well this year. A survey of analyst reports shows that the group is in position to generate EPS of closed to 30 sen.
At current price of RM2.10, the stock is still cheap.  
SEEK GUIDANCE FROM FUNDAMENTALS, DON'T LET EMOTION DICTATES YOUR INVESTMENT DECISIONS.

3. Private Placement Will Result In Strong Alignment of Management and Shareholders' Interest Certain investors are excited by the placement to Tony Fernandes and gang ("TF Incorporated"), but certain investors are not happy. The difference in opinion mostly centred on "allocation of value". But there is no dispute that with so much at stake, TF Incorporated will now be motivated to make it work. 
MANAGEMENT CUM MAJOR SHAREHOLDERS NOW HAVE STRONG INCENTIVE TO CREATE VALUE. THIS WILL SPILL OVER TO BENEFIT ALL OTHER INVESTORS.

4. Short Term Catalyst   I have never heard of a Tycoon that doesn't like leverage. TF Incorporated will almost certainly make use of margin facility to finance their placement subscription.
When come to margin financing, nothing convinces bankers more than strong share price - "Look, it is trading at RM2.50 now, and you are lending me money to buy at RM1.80. Why worry ?"
In a recent interview with The Star, Tony Fernandes mentioned that the Company targets to convene EGM for the placement on 9 May 2016. My guess is that the placement will be completed shortly after EGM, so as to wrap up the entire exercise before release of strong financial results by end May 2016. 
TONY INCORPORATED HAS INCENTIVE TO KEEP SHARE PRICE BUOYANT IN THE IMMEDIATE TERM SO AS TO FACILITATE SMOOTH DRAW DOWN OF MARGIN FACILITY BY SECOND HALF OF MAY 2016.

5. Act Contrarian To Blogger Z   There is an emerging consensus in i3 that if you act contrarian to Blogger Z, you are likely to do well.
SINCE BLOGGER Z IS UNCOMFORTABLE WITH AIR ASIA, WE SHOULD OVERWEIGH THE STOCK.


Air Asia (5) - CIMB Expects RM1.05 bln & RM1.35 bln Net Profit For FY16 and FY17 Respectively

Author: Icon8888   |   Publish date: Fri, 8 Apr 2016, 10:00 AM


For your reading pleasure. Huat ah !!!


AAX (3) - Which One Is Better Bet ? Air Asia or AAX ?

Author: Icon8888   |   Publish date: Sun, 3 Apr 2016, 01:49 PM 


Executive Summary
(a) Air Asia has market cap of RM5 billion, almost 4 times of AAX's RM1.2 billion. Out of curiosity, I made a comparison of Air Asia and AAX's operational and financial performance to try to figure out what set them apart.
(b) As expected, Air Asia emerged as the superior party with better business model and stronger financials. However, to make money in the stock market, buying good stock is not enough, we need to buy GOOD STOCKS WITH POTENTIAL FOR STRONG CAPITAL GAIN. From this perspective, both Air Asia and AAX offers equally exciting opportunity.    


1. Aircrafts

AAX's fleet comprises mostly A330 while Air Asia uses A320. The major details are as set out in table below, which is self explanatory.


(A330)


(A320)

You can try count the windows if you want to feel the length difference.


2. Balance Sheets

In FY2015, AAX generated revenue of RM3.1 billion, approximately 0.5 times of Air Asia's RM6.3 billion. Naturally, I expect AAX's balance sheet to be around half the size of Air Asia. But the actual fact is very different.


As shown above, AAX's total assets is only 0.19 times that of Air Asia. Its shareholders funds is 0.14 times. Its borrowings is only 0.13 times.

With less than 0.20 times balance sheets size, AAX is generating 0.5 times Air Asia revenue. Is AAX a more efficient operator ?

Not really. If a baby needs to drink 8 ounces of milk per day and you only feed him 4 ounces, there will be consequences. Please read the next section to find out more.  


3. Cost Structure

I used common size analysis to compare the two group's cost structure. Common size figures are derived by dividing respective group's expense items by its own revenue. That will allow us to feel the relative weightage of each item.


Key observations :-

(a) Staff cost weightage is more or less the same for both groups.

(b) Air Asia owns most of its aircrafts while AAX relies on leasing. As such, AAX has lower depreciation charges then Air Asia. Because of the same reason, AAX has higher operating lease than Air Asia (460% higher).

(c) Both groups have more or less same fuel usage.

(d) AAX has higher maintenance weightage than Air Asia (29% vs. 14%). Exact reasons unknown. One possibility is that it is due to AAX's longer flight distance. If that is the case, then that will be one of the major factors (negative) differentiating a long haul from short haul carrier. 

(e) AAX has lower net interest expenses than Air Asia (as a percentage of revenue, 2% vs. 8%). Does that mean that AAX has stronger financials ?
Not necessarily. In my opinion, an aircraft company's reliance on debt is manifested in interest expenses as well as leasing charges (a strong company at least can borrow to buy aircrafts, a weaker one probably doesn't even have the credit credentials to borrow. It can only lease, which is more expensive).
Compared to Air Asia, AAX has significantly higher leasing charges. If you take both lease charges and interest expenses into consideration, AAX's total is higher at 25% (= 23% + 2%) while Air Asia's total is only 13% (= 5% + 8%). 


4. Some Technical Terms

It is common for airline companies to disclose certain operational figures in their accounts. To be able to understand how an airliner functions, you need to know the follow terms :-

(a) Operating Lease - Instead of buying the aircrafts, an airliner can lease them from leasing companies, the two largest of which are International Lease Finance Corporation and GE Commercial Aviation Services.
Operating leases are generally short-term (less than 10 years in duration), making them attractive when aircraft are needed for a start-up venture, or for the tentative expansion of an established carrier.

(b) Wet Lease -  The aircraft is leased together with its crew. Such leases are generally on a short-term basis to cover bursts in demand, such as the Hajj pilgrimage. Usually, a wet-leased aircraft operates as part of the leasing carrier's fleet and with that carrier's airline code.

(c) Load Factor - It measures how full a flight is. For example, if an aircraft can carry 100 passengers and there are 80 passengers on board, load factor is 80%. The higher the load factor the better.

(d) Available Seat Kilometers (ASK) - Total number of seats is not reflective of an airliner's capacity. You must multiply it by the distance that it can travel (based on flights). 
For example : an aircraft with 100 seats and travels 400 km from KL to Penang will have ASK of 40,000. However, the same airacraft used to travel 2,500 km to Hong Kong will have ASK of 250,000. As passengers pay for distance travelled, the higher the ASK, the higher the revenue generating capacity.
Usually, ASK goes up when an airliner purchases (or lease) more aircrafts. Sometime when ASK is too high (resulting in low Load Factor), the airliner will try to cut it down by disposals or wet lease (happened to AAX last year). 

(e) Revenue Passenger Kilometers (RPK) - Measure of traffic by multiplying the number of revenue-paying passengers aboard the planes by the distance traveled.
The higher the RPK, the better. However, yield (Revenue/ASK or RASK) is also important. If RPK goes up but RASK comes down, revenue does not necessarily go up (price war).  

(f) Cost / ASK - Arrived at by dividing operating cost by ASK. The lower the figure, the higher the operational efficiency.
Sometime, to eliminate the distorting effect of fuel, Cost / ASK ex fuel is used. That will provide insight into how an airliner has been managing its cost.
As the bulk of an airliner's cost is denominated in USD. Strengthening of USD will result in Cost / ASK hike even though operational efficiency has improved, and vice versa. As a result, Cost / ASK in USD is sometime more reflective of the real picture. 


5. Operational Parameters

This section is very interesting. It clearly illustrates the differences between AAX and Air Asia's business models.


Key observations :-

(a) Revenue - AAX's fleet size is 30% of Air Asia but it generates closed to 50% revenue size. But that is because AAX flys longer distance. As such, the figures are meaningless for comparison purpose. As for load factor, both groups have more or less the same level of 80%.

(b) Unit Passenger Revenue - AAX's average flight distance of 4,844 km is approximately 4 times that of Air Asia's 1,232 km. Yet its average revenue per passenger of RM599 is only 3 times that of Air Asia's RM207.

In my opinion, the inability to set ticket price proportionate to distance must have been one of the major factors depressing profit margin. 

The question then is why is it that AAX can not increase the ticket price ? Malaysians are not that well off, but RM392 (being the difference between 599 and 207) is not really that big an amount. Nowadays, it is common for a medium size family to spend more than RM200 to have a dinner in restaurant (tilapia not a problem, sea cucumber might cost more).

That might be the case. However, if you multiply the figures by two (return trip), then you will immediately feel the pain. An Air Asia return trip will cost you RM414 (RM207 x 2), but an AAX return trip will cost you RM1,198 (being RM599 x 2). If AAX further increases the fee to RM828 (to reflect the 4 times longer distance), return trip will become RM1,656. Even for a small family of 3 (parents and one kid), the amount becomes RM4,968. This amount is not small. It will make many families hesitate and think twice.          

I believe the above analysis clearly demonstrates the constraint faced by AAX when come to pricing. Supply and demand dictates that it cannot raise its price too much or else risk losing relevance in the market. This is the Achilles heel of Long Haul Low Cost Carrier. 

(c) Profit / ASK - Apart from December 2015 quarter, AAX's Profit / ASK has always been negative (average loss of 0.29 US cents per kilometer). High fuel cost as well as strong USD (in 2015) were two of the major reasons.   
Air Asia is different, despite high oil price, it has consistently been profitable (in actual fact, very profitable) with average profit of 0.91 US cent per km.
This is consistent with discussion in (b) above about the different pricing power of long and short haul LCC.


6. Concluding Remarks

(a) According to industry report set out in AAX's IPO prospectus, there were only four long haul low cost carriers in the world (back in 2012). The only logical conclusion is that the business must be quite difficult until not many people bother to venture into it.

(b) My analysis confirmed that AAX's business is indeed not easy. To be specific, there are two major factors that weigh on AAX :-

(i) Undercapitalised Balance Sheets - It is obvious that AAX's balance sheets is a bit small for its existing scale of operation.
This is probably by design - Tony Fenandes must have known that Long Haul LCC is not easy (if Icon can figure that out, I am sure Tony Fernandes can also). To minimize risk exposure, he probably decided not to commit too much capital.
The end result is that AAX needs to rely heavily on operating lease, which is more expensive and adversely affect profit margin.

(ii) Nature of Business - Section 5 above highlights how AAX is constrained by lack of pricing power. There is nothing much the company can do. The only way to mitigate this problem is to manage cost.
I have no doubt about the Air Asia Group's ability and passion to be efficient and cut cost. Unfortunately, in the past few years, many things were beyond their control. High oil prices and Ringgit depreciation inflicted a heavy toll on the AAX group.  

(c) Well, having told such a long story, what exactly is my stance when come to AAX ? 
I AM POSITIVE ABOUT THE GROUP. 

First of all, I can live with AAX's existing reliance on Operating Lease. Fair enough, it is more expensive. However, to get rid of that would require massive expansion in equity base, which will dilute EPS. If AAX can manage the financial risk, I am happy to keep the existing capital structure intact. Don't fix something if it is not broken.

Secondly, oil price has recently fallen to very low level. Different people have different opinion, but my view is that it will remain low for an extended period of time - US' shale oil reserve is 4 times that of Saudi Arabia (!!!), and shale oil production is someting that can be ramped up within a short period of time, should demand beginning to outsrip supply due to certain reasons. How can oil price spike ?

Low oil price not only reduces expenses, it will also encourage usage of air travel. As cost declines, airlines can pass on some of the saving to consumers. Many routes that are previously not viable will now attract more passengers. A virtue cycle.

Thirdly, let's not worry too much about competition (Malindo ?). I think the world is pretty big. When a pie is growing, everybody can have a share, no need to fight to the death.  

Last but not least, in my previous article, I highlighted that 80% of AAX's operating expenses are denominated in USD (Air Asia's net exposure is only 30%). If that is the case, there should be HUGE earnings upside for AAX if the Ringgit strengthens. Air Asia has stronger fundmentals, but AAX might be able to deliver greater positive surprises.

I love Lucy and I love Ann, both also I want to marry.

Air Asia (4) - Tony Fernandes Sell Car Sell House To Sai Lang At RM1.84

Author: Icon8888   |   Publish date: Fri, 1 Apr 2016, 06:38 PM 


(How often do you encounter oil price at such low level for extended period of time ? Tony Fernandes decided to bet big)

Today, Air Asia announced that Tony Fernandes and buddy will be forking out RM1 billion to subscribe for 559 mil new Air Asia shares at RM1.84. Some forum members worried that this will cause Air Asia shares to crash upon uplifting of suspension on Monday (because of EPS dilution of 20%).

Are you kidding me ? The founder and CEO of a PLC is forking out RM1 billion to buy his own company's shares at zero discount to market. He will only do that if he is convinced that share price can easily stay above RM1.84 (even after EPS dilution).

TONY FERNANDES IS PUTTING MONEY WHERE HIS MOUTH IS. THAT IS A BIG VOTE OF CONFIDENCE FOR AIR ASIA.

I interprete this latest development VERY POSITIVELY. As Tony Fernandes' funding is very likely from margin facility, he will be under pressure to ensure that share price will perform. Over the next one to two years, we can expect a series of road shows to fund managers as well as multiple value unlocking exercises to ramp up share price.

Air Asia is truly living up to its promise that NOW EVERYONE CAN FRY.

AAX (2) - HUGE, HUGE, HUGE Beneficiary Of Ringgit Appreciation

Author: Icon8888   |   Publish date: Tue, 29 Mar 2016, 03:31 PM 


I first wrote about AAX on 23 March 2016. In the concluding remarks, I mentioned that I am positive about the group's prospects :-


My view on AAX's USD exposure is similar to that of Alliance DBS Research. According to the research house, more than 75% of Air Asia X's expenses are denominated in USD.


Is it true that more than 75% of AAX's expenses are denominated in USD ? How big is the impact of Ringgit appreciation on AAX ? Let's run some numbers to find out.

The finding is startling. According to table below, as much as 80% of AAX's expenses are denominated in USD (being 629 divided by 785).


According to sensitivity analysis below, every 10 sen strengthening of Ringgit will result in cost saving of RM63 mil per annum for AAX. Based on 4,150 mil shares, EPS enhancement of 1.5 sen.


In the previous quarter ended 31 December 2015, the average exchange rate was 4.285. We are now closed to end of March. The average exchange rate for the first three months of 2016 was approximately 4.20. By applying the analytical tool above, strengthening of Ringgit by 0.085 should result in cost saving of RM53 mil per annum, or RM13 mil per quarter.

In the recent few weeks, the Ringgit has been hovering at around 4.00. For discussion purpose, if the quarterly average exchange rate is 4.00, cost saving will be USD629 mil x 0.285 = RM179 mil per annum, or 4.3 sen EPS.


Concluding Remarks

CIMB recently released a pessimistic research report on AAX. If that analyst is reading this article, I would like to let him know that it is ridiculous to ascribe a fair value of 15 sen to AAX.   

No doubt AAX's past performance was less than satisfactory, but its operating environment has improved substantially over past few months. In the face of favorable risk reward balance, it is time to take a more positive view on the group.

The figures shown above might sound far fetched, but they were arrived at based on objective analysis without undue manipulation. If you managed to identify any flaw in my assumptions or calculations, please don't hesitate to share your thoughts with me. I am keen to listen to your view. 

Having said so, even if I am only 50% correct, the implication is still very substantial - due to AAX's huge USD denominated operating and financing expenses, strengthening of Ringgit will have very huge positive impact on its profitability. 

I maintain positive view on AAX.

Air Asia (3) - How Much Will It Benefit From Ringgit Appreciation ?

Author: Icon8888   |   Publish date: Tue, 29 Mar 2016, 11:58 AM


According to Alliance DBS Research, more than 75% of Air Asia X's expenses are denominated in USD.


As Air Asia has same business model as AAX, I wonder whether it has a similar cost structure ? To find out how the strengthening of Ringgit will affect Air Asia, let's take a closer look at its historical P&Ls.

If I am not wrong, the yellow highlighted items should be mostly denominated in USD. 

For revenue, the final quarter of aircraft operating lease was unusually high. I normalised the figure by annualising January to September 2015 figures to arrive at USD248 mil as full year estimate.

For expenses, the FY2015 fuel figure was based on USD82 per barrel. In FY2016, the likely price per barrel should be USD59 (Air Asia has hedged 50% of its requirement at that price). Based on 6.28 million barrels, fuel expense should be USD371 mil.

Based on the adjusted fuel cost, total expense would be approximately USD1.25 billion, out of which USD631 mil will be denominated in USD. This represents approximately 50% of total expenses.

However, after being offset against USD248 mil operating lease revenue, net Dollar denominated expenses is only USD383 mil, representing 30% of expenses.

To determine the impact of USD movement, I did a quick sensitivity analysis based on base case of 4.1 and USD383 mil :-

According to table above, every RM0.10 movement in RM vs USD will result in RM38 mil changes. Based on 2.783 billion shares, approximately 1.4 sen impact on EPS.

LB Aluminium (3) - Excellent Result, Profit Back To Previous All Time High

Author: Icon8888   |   Publish date: Fri, 25 Mar 2016, 08:28 PM 


1. Introduction

The title of my previous article for LB was "Sun Rise or False Dawn ?". 


That was because in the previous quarter ended 31 October 2015, the group showed signs of turning around and I was not sure whether it will be able to sustain the momentum.

Today, LB released its January 2016 quarterly report. The result is very satisfactory. Looked like it is not a false dawn (touch wood).


2. Latest Quarter Result

Compared to previous quarter, revenue has not grown by much. However, EBITDA margin improved substantially, reaching an ALL TIME HIGH of 12.6%.


This item alone single handedly elevated net profit by almost 100% (compared to previous quarter).

As a matter of fact, in my previous article, I have identified EBITDA margin as an important factor to watch. Please refer to cut and paste below :-


In this latest quarter, it seemed that the group not only able to maintain the positive momentum, but improved further on it.

One of the contributing factor is of course the lower raw material cost (aluminium price was 1.8% lower). However, in my opinion, that should not be sufficient to deliver such strong growth in EBITDA margin. The group must have been successful in passing higher cost to customers, as mentioned in previous article.


3. Aluminium Price

For those not familiar with this group, let me point out (once again) that Aluminium is used as raw material by LB. As such, high Aluminium price will adversely affect the group, and vice versa. 

According to Index Mundi, latest Aluminium price is USD1,577 per MT.


This is an increase of 6.4% compared to LB's estimated cost of USD1,482 per MT during the period from November 2015 until January 2016. However, the Ringgit has strengthened from 4.328 per USD to 4.028 now. Based on the latest exchange rate, LB's estimated Aluminium cost is RM6,352 per MT. This works out to be approximately 1% lower than previous quarter's RM6,414 per MT.

Of course, the above figures are for discussion purpose only. The group's actual cost might be different as it is dependent on timing of buying, hedging policy, etc. However, the general idea is still that recent Ringgit strength could play a role in mitigating rise of USD Aluminium price. Let's wait for next quarter to find out the truth.


4. Concluding Remarks

I have only good things to say about this quarter's result. As mentioned in my previous article, LB has a difficult time in the past few quarters. However, it seemed that things had stabilised. Hopefully the positive momentum can be sustained. 

If you annualise the past 3 quarter EPS, you will arrive at EPS of 5.3 sen for FY2016. At current price of 50 sen, prospective PER will be 9.5 times.

However, if you annualise the latest quarter EPS, you will arrive at EPS of 8.4 sen for FY2017. At current price, prospective PER will be 6 times.

It is up to you to decide which EPS is more reflective of the group's prospects. Your money your choice.

Comcorp (5) - Final Episode

Author: Icon8888   |   Publish date: Fri, 25 Mar 2016, 06:12 PM

I bought Comcorp at 43 sen in December 2015. Today it closed at 83 sen.

90% appreciation in 3 months. 

My portfolio generates good return when the stocks I bought report strong results. It is honest profit, I deserve every single sen of it. 

Who say I need to pump and dump in order to make money ? 

This is for you, kk123.

Comcorp (4) - Excellent, Excellent Results

Author: Icon8888   |   Publish date: Thu, 24 Mar 2016, 08:25 PM 

Comcorp released its January 2016 quarterly result this evening. The result is excellent. Please refer to table below, which is self explanatory.


Note : if I am not wrong, the latest quarterly report posted by Comcorp on Bursa is not complete. As such, I am not able to determine whether the latest quarter contains any exceptional items. I will update this article once it is made available

Since I wrote about Comcorp in December 2015, one of the most frequent heard complains was that Comcorp's electronic manufacturing division relied purely on strong USD to survive. 

My study showed a different picture. Comcorp's electronic manufacturing division has been producing EBIT of approximately RM4.2 mil even when Ringgit was as strong as 3.468 per USD (please refer to January 2015 quarter figures in table above).

After deducting RM0.5 mil interest expense and assume zero tax, quarterly net profit is approximately RM3.7 mil per quarter, or EPS of 2.6 sen. If annualised, full year EPS could be as high as 10 sen (even with exchange rate at 3.468).

The reason why Comcorp has not been perfoming well in the past is because of losses incurred by the IT division. In the latest quarter, this division has broken even. Can the IT division continue to break even going forward ? Nobody knows. But my point is that Comcorp's manufacturing division is more resilient than many people think.

This stock would have fly if not because of recent strengthening of Ringgit. Even though my view is that strong USD should last for few more years, if you are uncomfortable with the prospects of export sector, you should consider taking the opportunity to trim your position tomorrow. 

As for me, I will just dumb dumd hold.