Savoring the Sweet Fruits of Ringgit Depreciation
Author: Icon8888 | Publish date: Wed, 4 Mar 2015, 10:01 AM
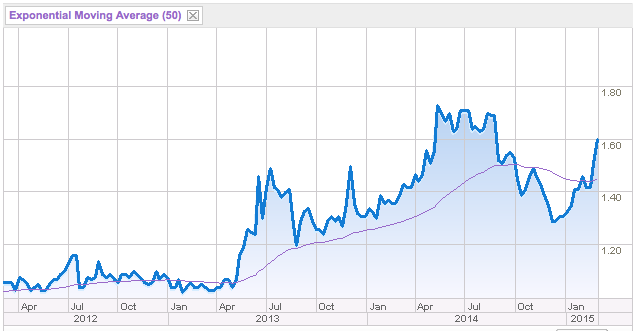
Y.s.p.southeast Asia Holding (YSP) Snapshot
Open
1.60
|
Previous Close
1.52
| |
Day High
1.61
|
Day Low
1.56
| |
52 Week High
05/14/14 - 1.85
|
52 Week Low
12/16/14 - 1.19
| |
Market Cap
211.5M
|
Average Volume 10 Days
44.4K
| |
EPS TTM
0.12
|
Shares Outstanding
133.0M
| |
EX-Date
07/16/14
|
P/E TM
12.8x
| |
Dividend
0.07
|
Dividend Yield
4.09%
|
Y.S.P. Southeast Asia Holding Berhad manufactures and trades various kinds of pharmaceutical products.
The company provides prescription products comprising antibacterial and analgesic lozenges, antibiotics, antidiarrheals, antiemetics, antihistamines, etc.
The company also offers non-prescription products, such as anthelmintic agents, antacids, anti-inflammatory enzymes, etc.
In addition, it provides veterinary pharmaceutical products for aquatic and live stock, including anthelmintics, antibiotics, antifungals, anticoccidial agent, antipyretics, etc.
The company also offers disposables, medical devices, test kits, first aids, medical aids, and insect repellents.
It operates in Malaysia, Singapore, the Philippines, Vietnam, Cambodia, Myanmar, Brunei, and internationally. The company was founded in 1987 and is headquartered in Kuala Lumpur, Malaysia.
The group has a solid profit track record. Even during the 2008 and 2009 financial crisis, it was able to maintain same level of profitability. This shows the group has a very defensive and resilient business model.
Annual Result:
| F.Y. | Revenue ('000) | Profit Attb. to SH ('000) | EPS (Cent) | PE | DPS (Cent) | DY | NAPS | ROE (%) |
|---|---|---|---|---|---|---|---|---|
| TTM | 202,289 | 16,492 | 12.40 | 12.83 | 6.50 | 4.09 | 1.7700 | 7.01 |
| 2014-12-31 | 202,289 | 16,492 | 12.40 | 10.49 | 6.50 | 5.00 | 1.7700 | 7.01 |
| 2013-12-31 | 190,827 | 16,191 | 12.17 | 11.02 | 6.50 | 4.85 | 1.7000 | 7.16 |
| 2012-12-31 | 180,610 | 13,628 | 10.24 | 10.16 | - | - | 1.6400 | 6.24 |
| 2011-12-31 | 156,773 | 15,380 | 13.24 | 7.56 | 6.00 | 6.00 | 1.6000 | 8.28 |
| 2010-12-31 | 138,483 | 12,157 | 12.16 | 8.97 | 6.00 | 5.50 | 1.7100 | 7.11 |
| 2009-12-31 | 130,775 | 12,060 | 14.43 | 7.14 | 6.00 | 5.83 | 1.5700 | 9.19 |
| 2008-12-31 | 124,016 | 12,367 | 12.87 | 7.15 | 6.00 | 6.52 | 1.8000 | 7.15 |
In the latest quarter ended December 2014, the group reported significant jump in earnings.
Quarter Result:
| F.Y. | Quarter | Revenue ('000) | Profit before Tax ('000) | Profit Attb. to SH ('000) | EPS (Cent) | NAPS |
|---|---|---|---|---|---|---|
| 2014-12-31 | 2014-12-31 | 54,924 | 9,977 | 7,018 | 5.27 | 1.7700 |
| 2014-12-31 | 2014-09-30 | 49,821 | 5,003 | 3,055 | 2.30 | 1.7100 |
| 2014-12-31 | 2014-06-30 | 46,112 | 2,267 | 964 | 0.72 | 1.6800 |
| 2014-12-31 | 2014-03-31 | 51,432 | 7,983 | 5,455 | 4.10 | 1.7400 |
| 2013-12-31 | 2013-12-31 | 48,784 | 5,540 | 4,072 | 3.06 | - |
| 2013-12-31 | 2013-09-30 | 46,638 | 5,363 | 4,167 | 3.13 | 1.6700 |
| 2013-12-31 | 2013-06-30 | 46,622 | 5,019 | 3,514 | 2.64 | 1.6400 |
| 2013-12-31 | 2013-03-31 | 48,783 | 6,097 | 4,438 | 3.34 | 1.6800 |
| 2012-12-31 | 2012-12-31 | 46,476 | 3,891 | 2,600 | 1.95 | - |
| 2012-12-31 | 2012-09-30 | 45,551 | 4,696 | 2,604 | 1.96 | 1.6200 |
| 2012-12-31 | 2012-06-30 | 45,307 | 5,911 | 4,542 | 3.41 | 1.6100 |
| 2012-12-31 | 2012-03-31 | 43,276 | 5,653 | 3,882 | 2.92 | 1.6300 |
The higher profitability was due to better performance of the manufacturing division.
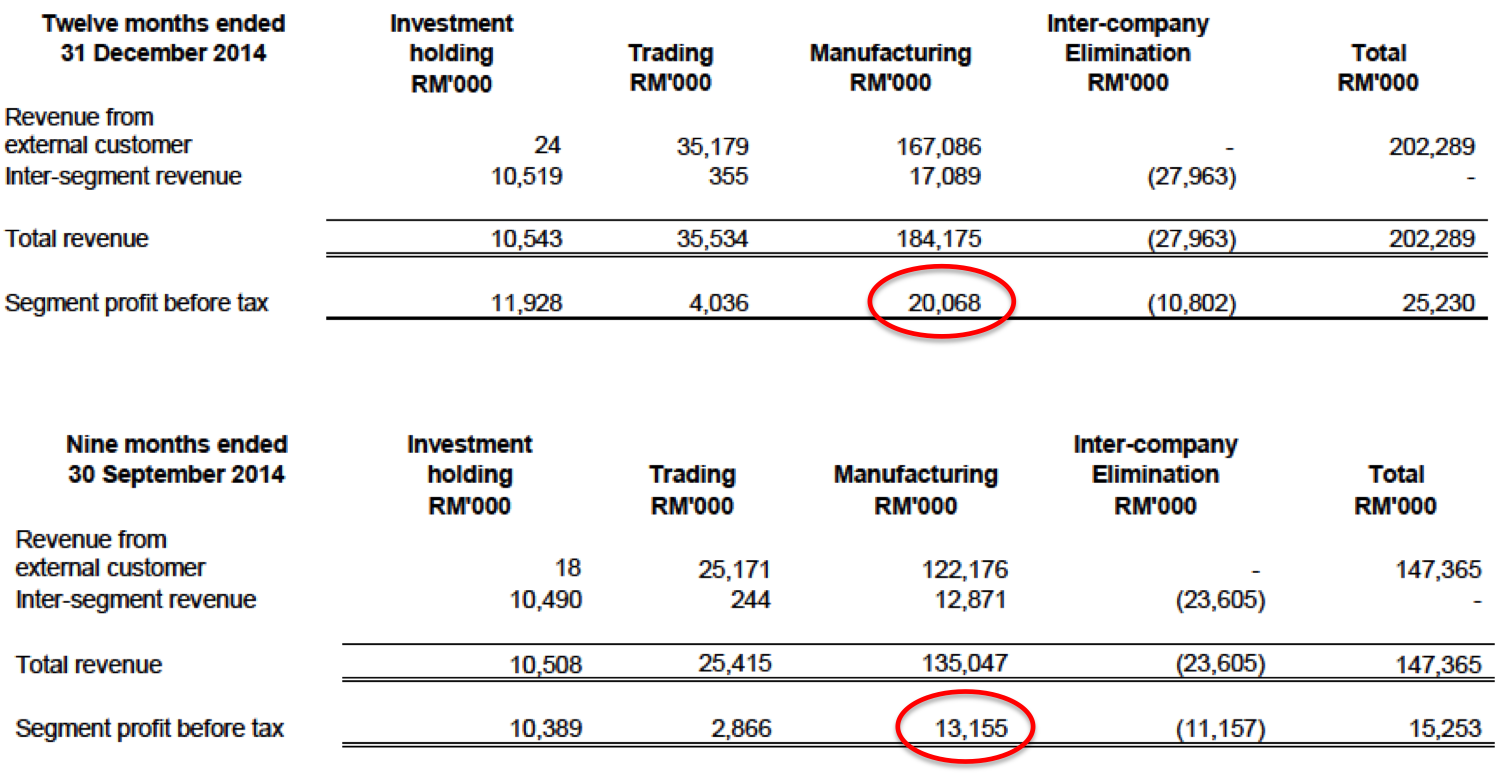
During the first 9 months ended September 2014, manufacturing division generated total revenue of RM122 mil. This translates into average revenue of RM40.7 mil per quarter. However, during the December 2014 quarter, manufacturing division generated revenue of RM45 mil (being RM167 less RM122 mil), an increase of RM4.3 mil or 10.5%.
During the first 9 months ended September 2014, manufacturing division generated total PBT of RM13.16 mil. This translates into average PBT of RM4.4 mil per quarter. However, during the December 2014 quarter, manufacturing division generated PBT of RM6.9 mil (being RM20.1 less RM13.2 mil), an increase of RM2.5 mil or 57%.
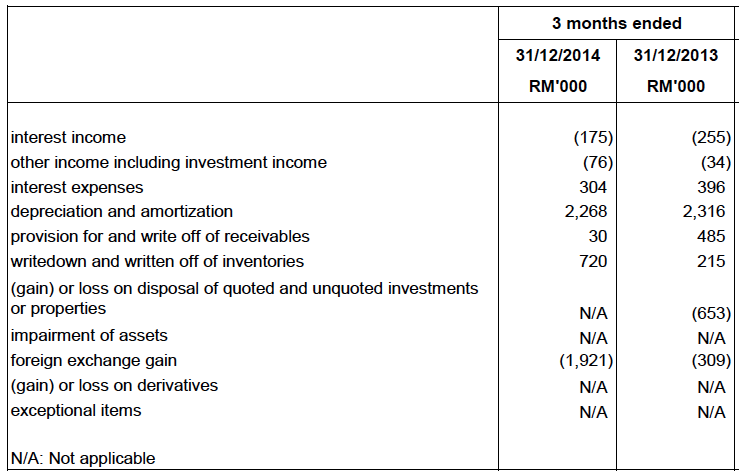
In the latest quarter, forex gain contributed RM1.92 mil to net profit.
But this was not the only reason proftiability was up. The company stated that higher revenue was due to increase in export :-

Unlike Hovid which sells more than 60% of its products overseas, YSPSAH's export sales is only 21% of its total sales.
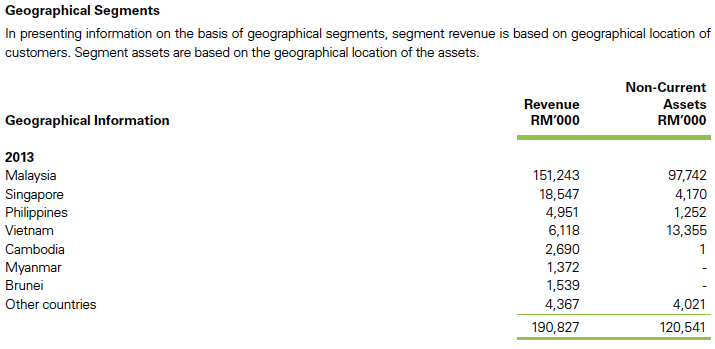
However, YSP should still be able to benefit from the the weaker currency. With the newly acquired price competitiveness, the group should be able to grow its exports at the expense of other countries' exporters.
Management's comments on the group's prospects :-
The company paid 6.5 sen dividend in FY2014. Based on RM1.59 share price, dividend yield is 4.1%.
No comments:
Post a Comment